TrueDialog Portal
Dashboard
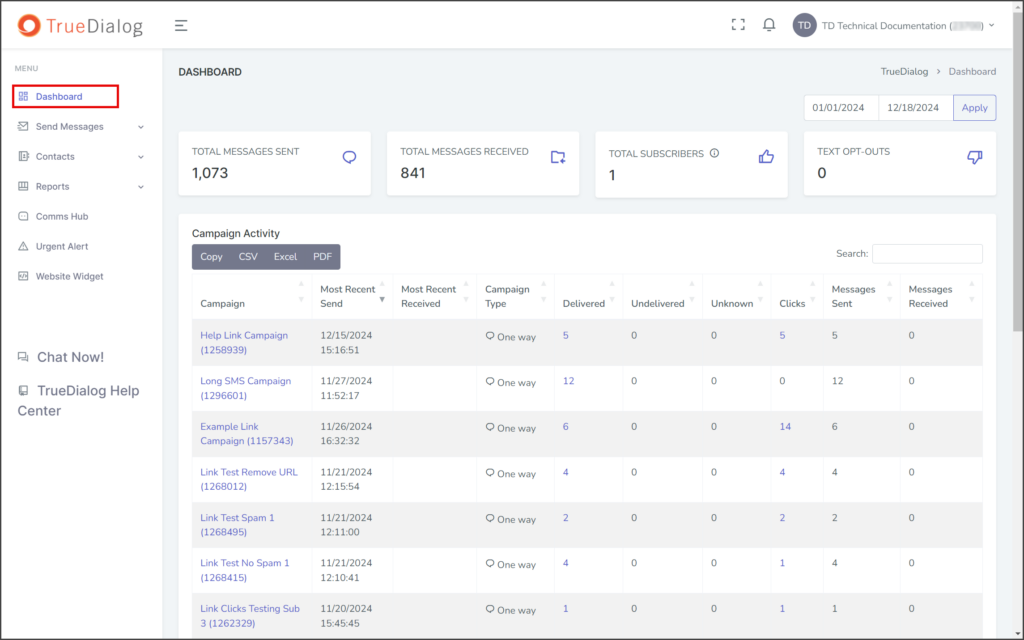
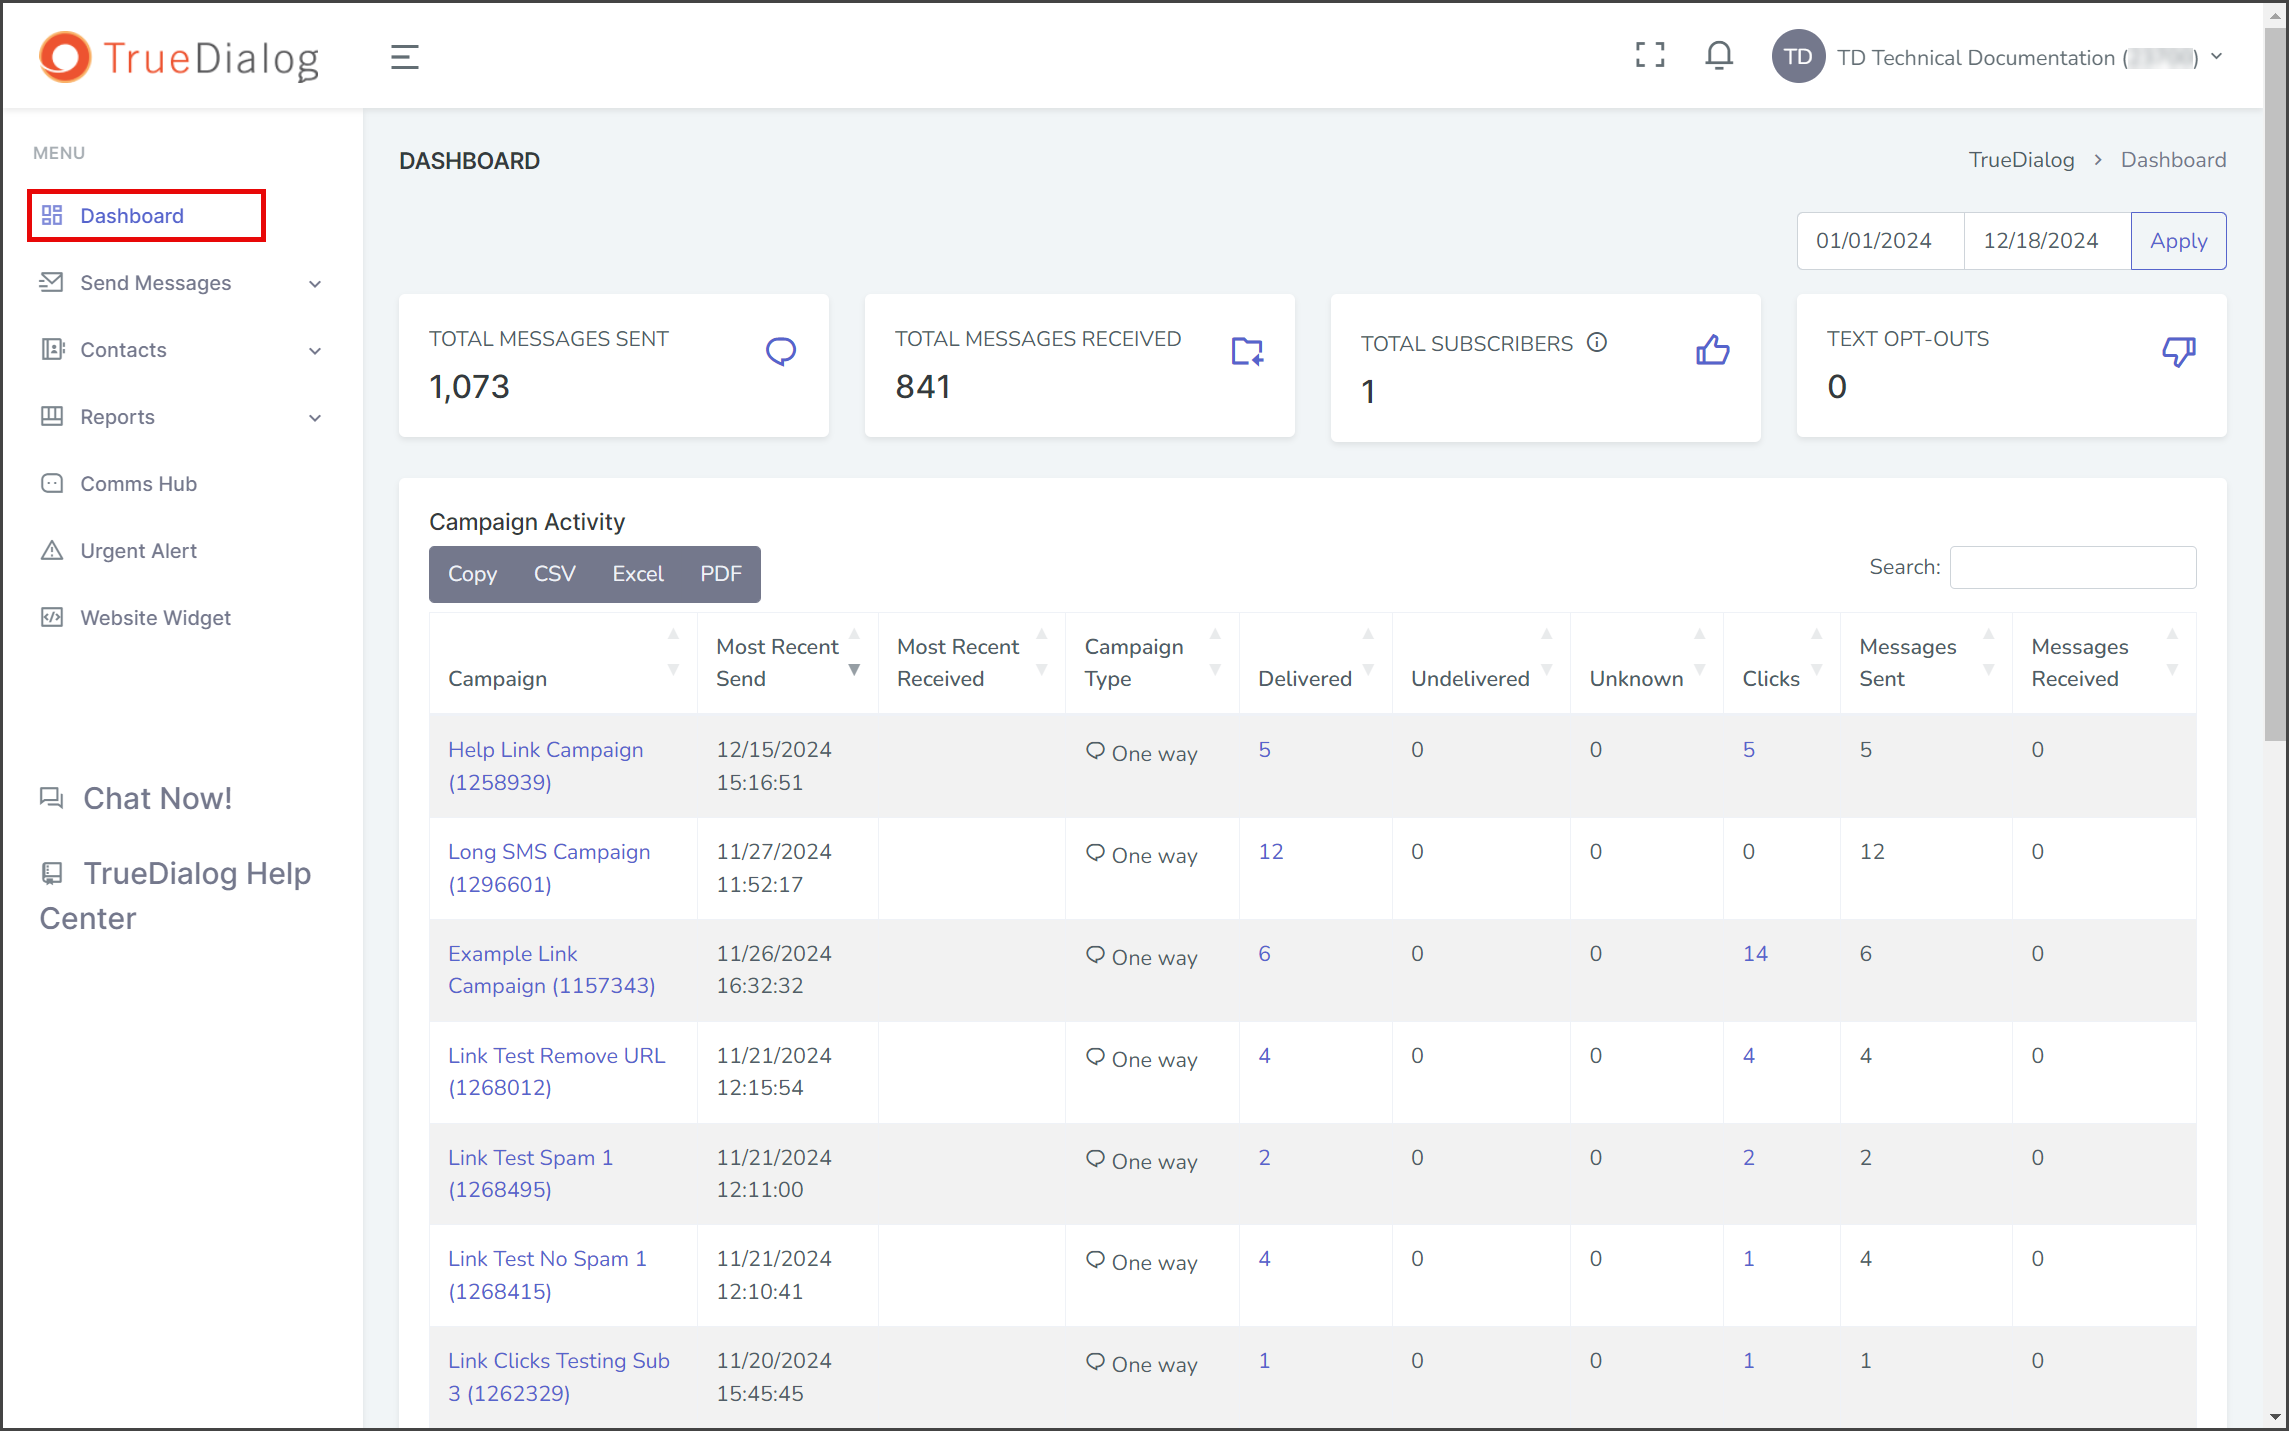
This article will explain the features of the Dashboard page. The Dashboard has three main sections: Account Activity, Campaign Activity, and Account Charts.
- Click Dashboard in the left sidebar.
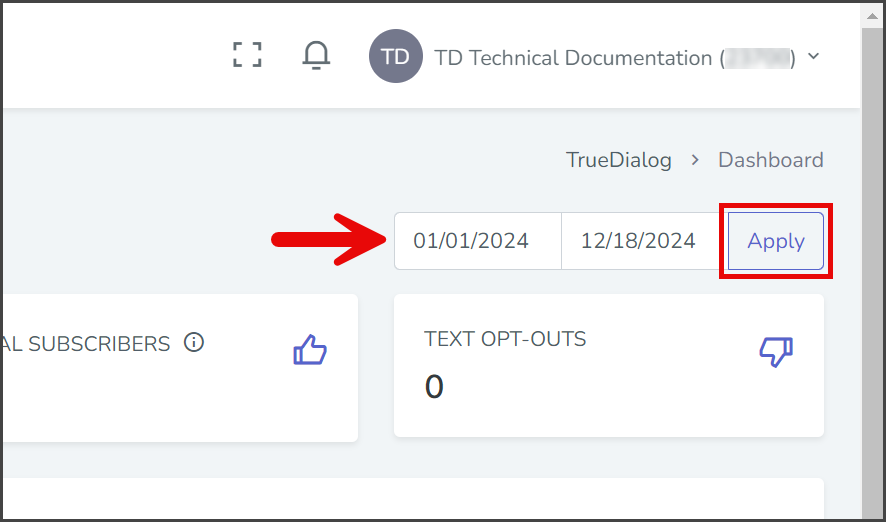
Date Range
By default, the Dashboard displays data for the last 30 days. The date range can be changed by:
- Enter the start date and end date in the date boxes. Optionally, the dates can be selected using the calendar widget that appears when selecting one of the date boxes.
- Click Apply to update the date ranges for Campaign Activity and Account Charts.
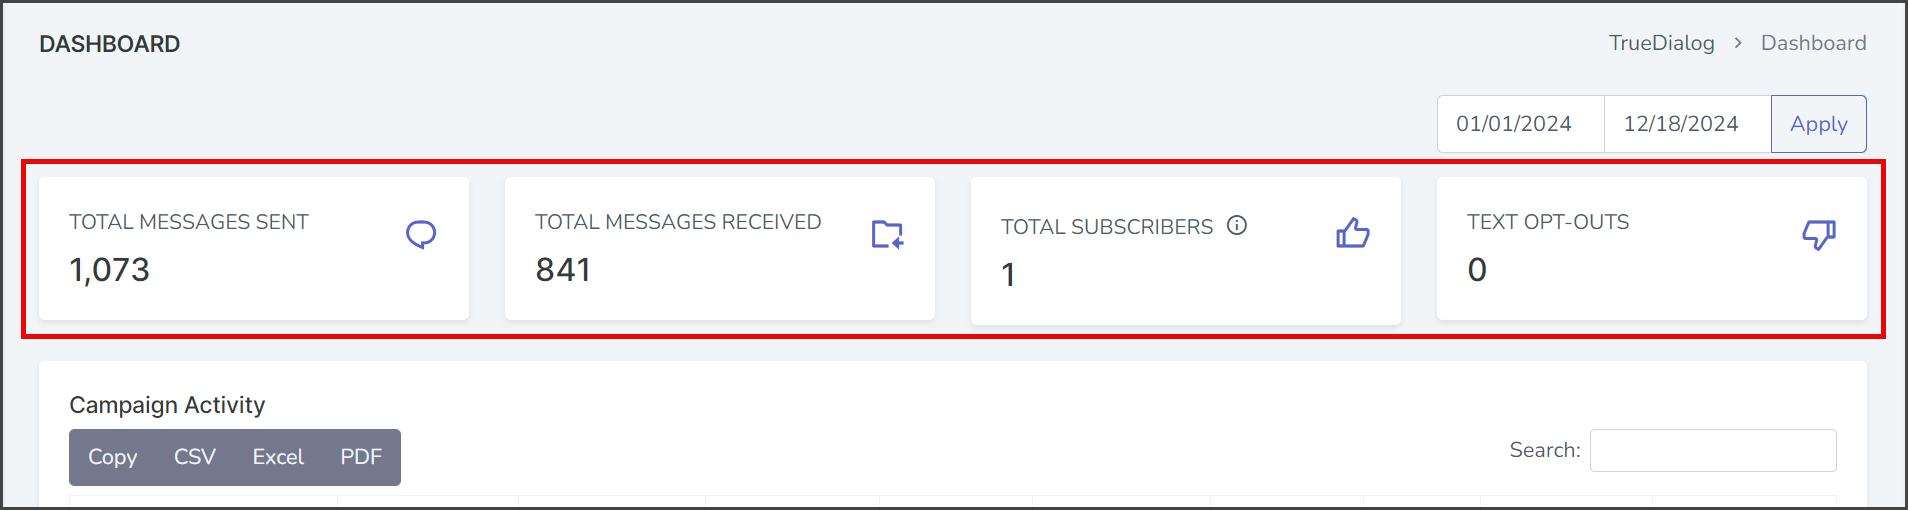
Activity Snapshot
This section provides an overview of your entire account, starting from the day it was created.
| Name | Description |
|---|---|
| TOTAL MESSAGES SENT | The number of messages sent from all campaigns. |
| TOTAL MESSAGES RECEIVED | The number of messages the account has received from end users. |
| TOTAL SUBSCRIBERS | The number of active and inactive contacts who are subscribed to any subscription. |
| TEXT OPT-OUT | The number of subscribers that opted out of a campaign. |
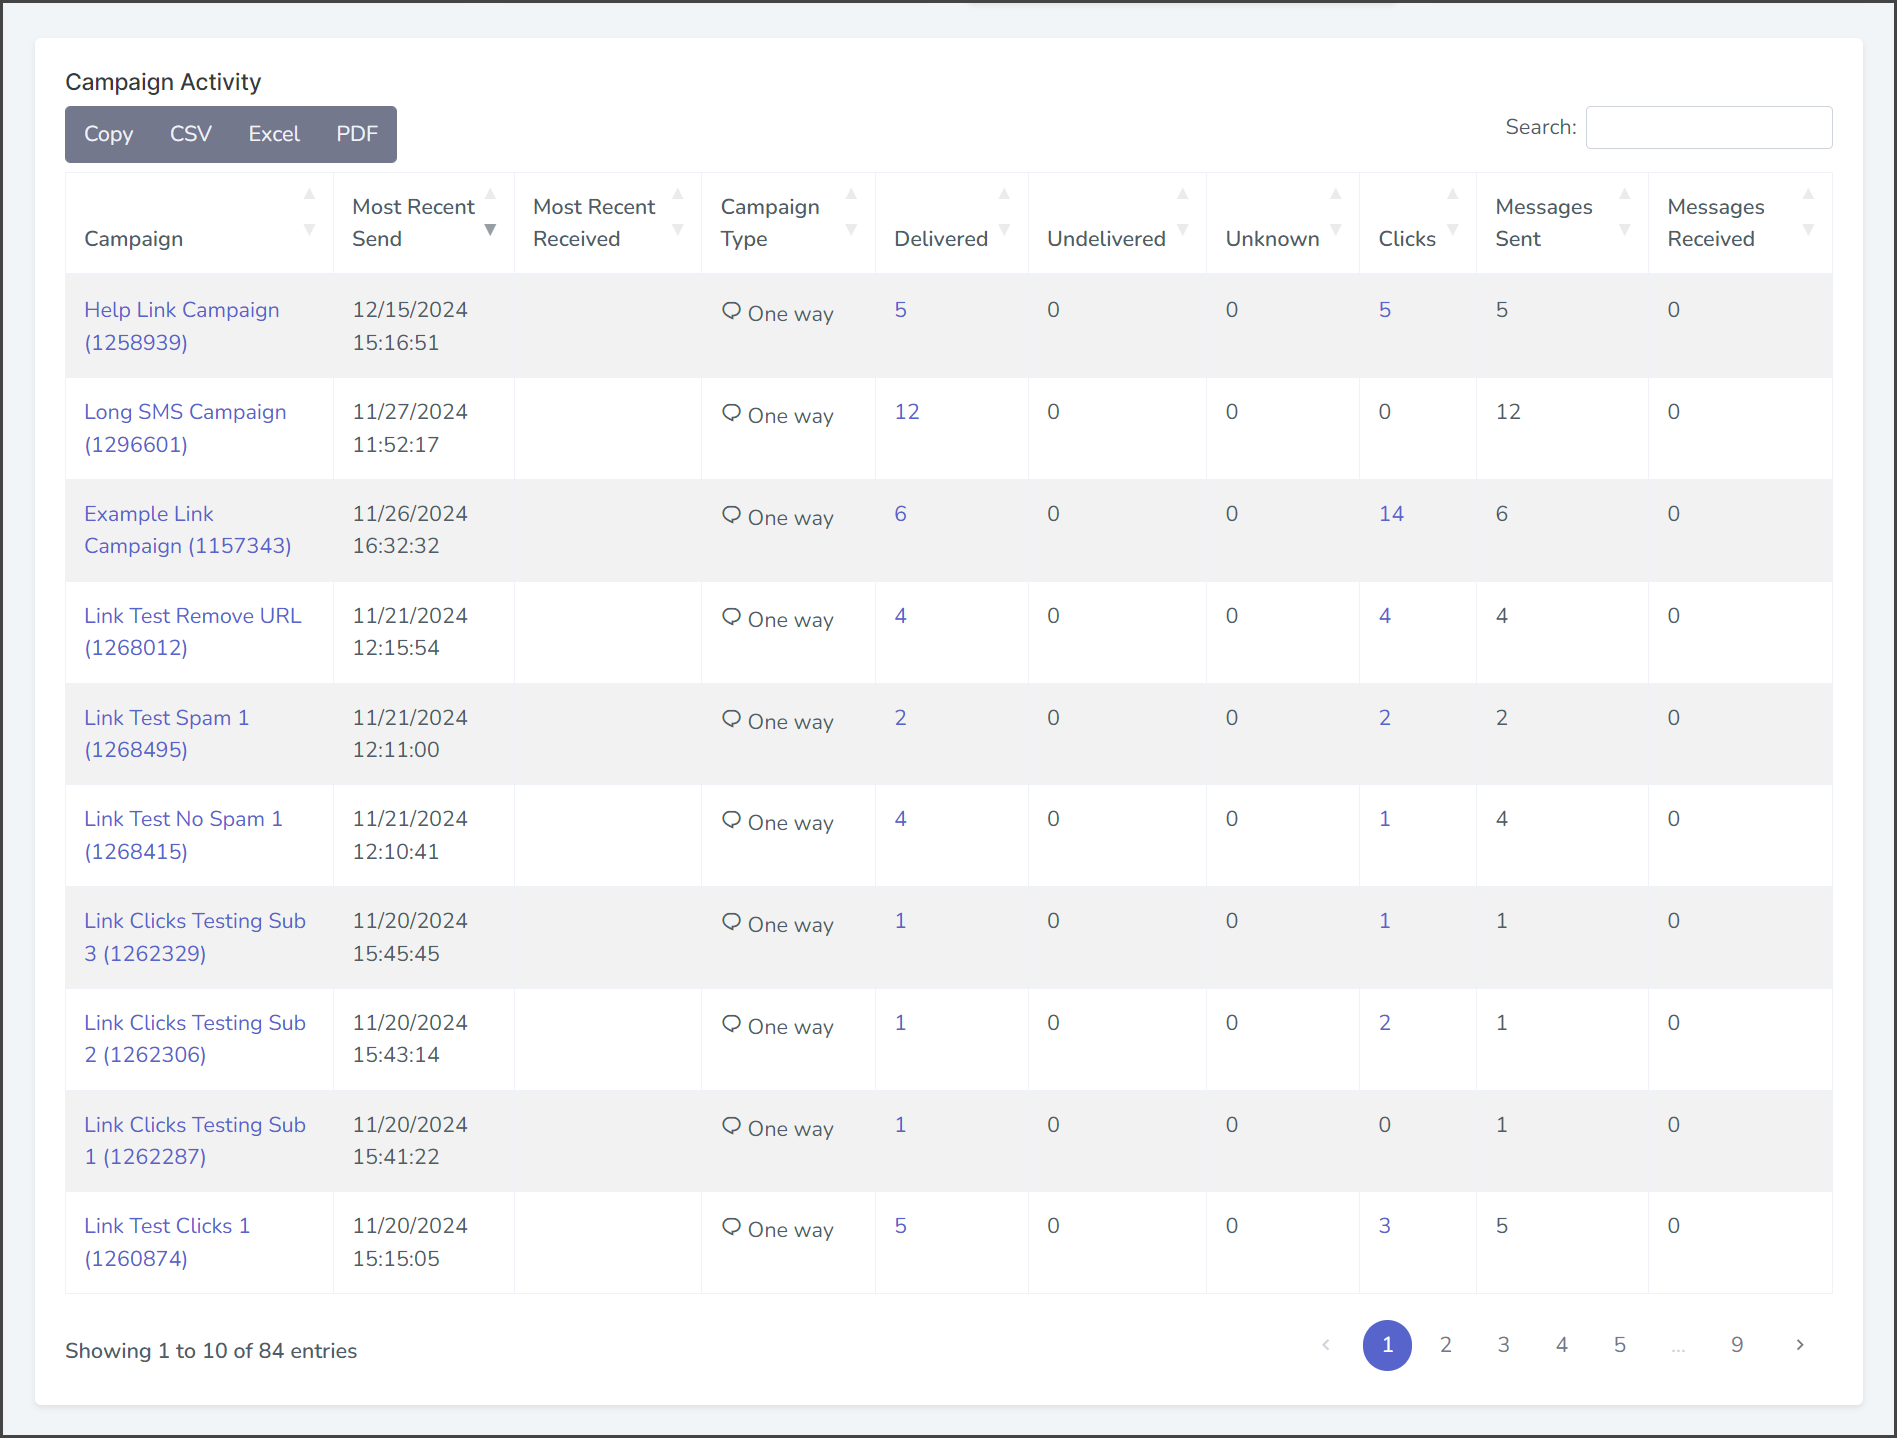
Campaign Activity Table
This section presents data on message activity for your campaigns over the selected date range in a table format.
| Column Name | Description |
|---|---|
| Campaign | The name and ID of the campaign. Clicking on an individual campaign will take you to a detailed report for the campaign. |
| Most Recent Send | Date and time of the last message sent by this campaign. |
| Most Recent Received | Date and time of the last message received by this campaign. |
| Campaign Type | Type of campaign. See the Sending Messages Overview article for an explanation of each campaign type. |
| Delivered | The number of messages with carrier delivery code confirming a delivered message. If not zero, click the number to view the Delivery Status Report. |
| Undelivered | The number of messages with carrier delivery codes indicating an undelivered message. |
| Unknown | The number of messages with no carrier delivery code. |
| Clicks | Number of clicks on Link Tracking URLs by users. If not zero, click the number to view the Clicks Report. |
| Messages Sent | Total messages sent, including delivered, undelivered, and unknown. |
| Messages Received | Total messages received from users. |
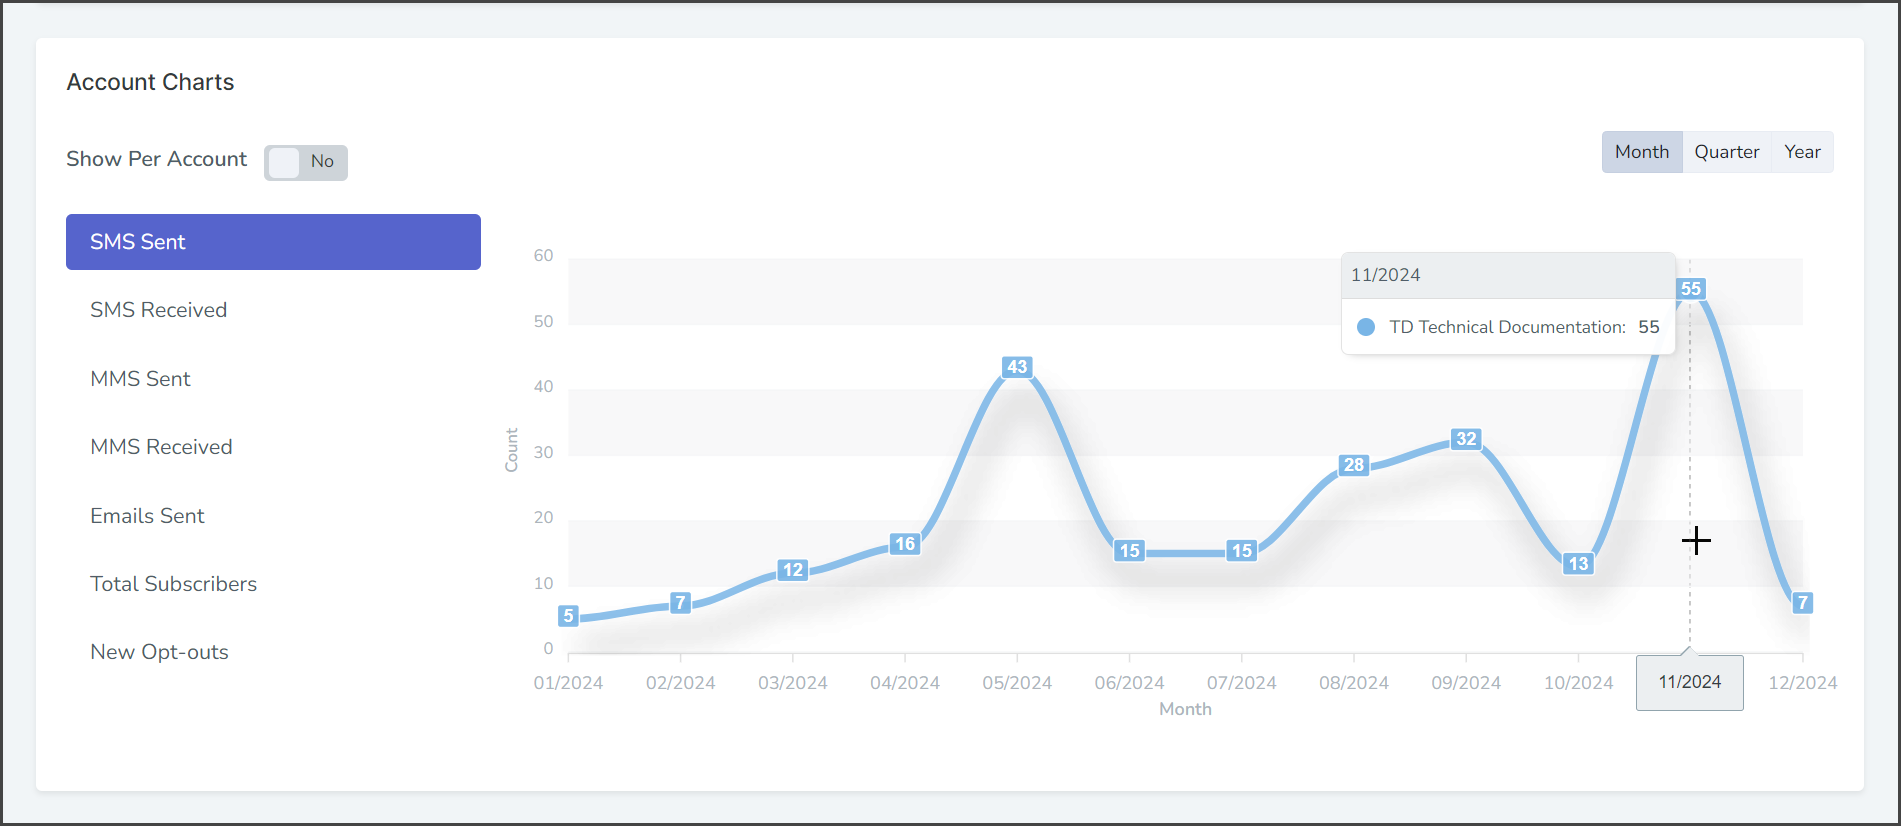
Account Charts
This section displays a chart showing various account statistics over time.
- The time interval for the chart can be switched between Month, Quarter, and Year.
- The Date Range (at the top of the page) sets the range of the chart.
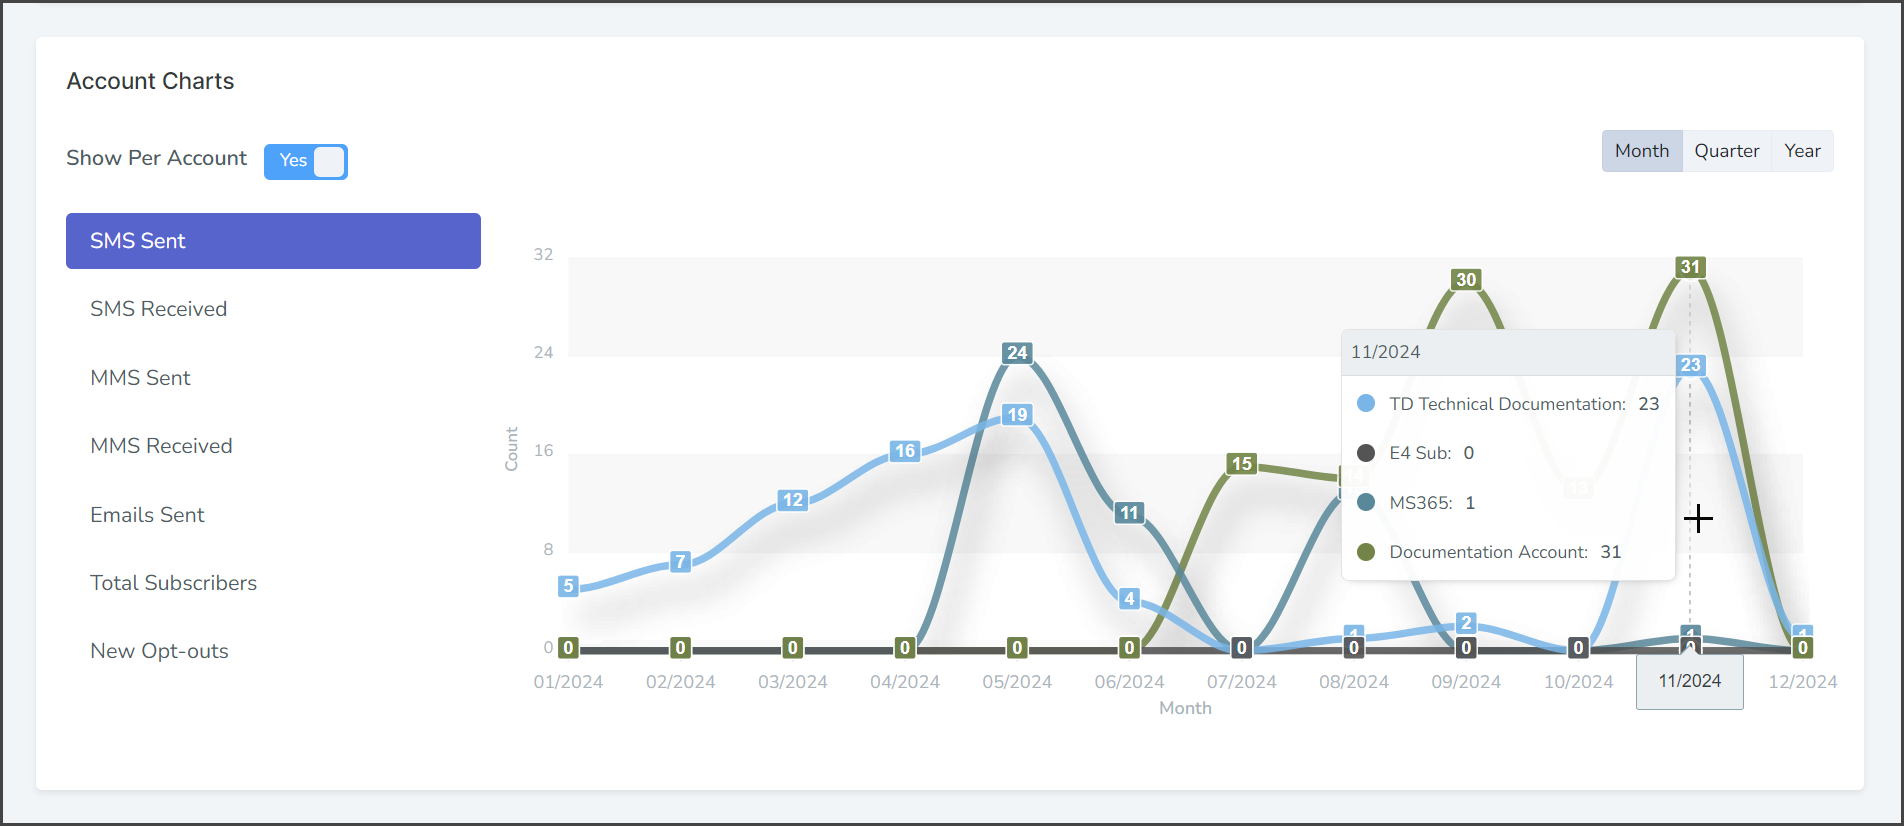
- The Show Per Account toggle:
- Yes – The root account and each subaccount are charted as a different color-coded line. See the example below.
- No (Default) – The totals from all accounts are charted as one line.
- When the mouse cursor hovers over the chart, a window shows the chart data for that specific time. If Show Per Account is enabled, each account’s color, name, and total are shown in the window.
| Chart Type | Description |
|---|---|
| SMS Sent | Charts the number of SMS messages sent from all campaigns during the time interval. |
| SMS Received | Charts the number of SMS messages received from end users during the time interval. |
| MMS Sent | Charts the number of MMS messages sent from all campaigns during the time interval. |
| MMS Received | Charts the number of MMS messages received from end users during the time interval. |
| Emails Sent | Charts the number of emails sent from all campaigns during the time interval. |
| Total Subscribers | Charts the current number of subscribers to all campaigns during the time interval. |
| New Opt-outs | Charts the number of subscribers that opted out during the time interval. |