TrueDialog Portal
Reports > Subscriptions Report
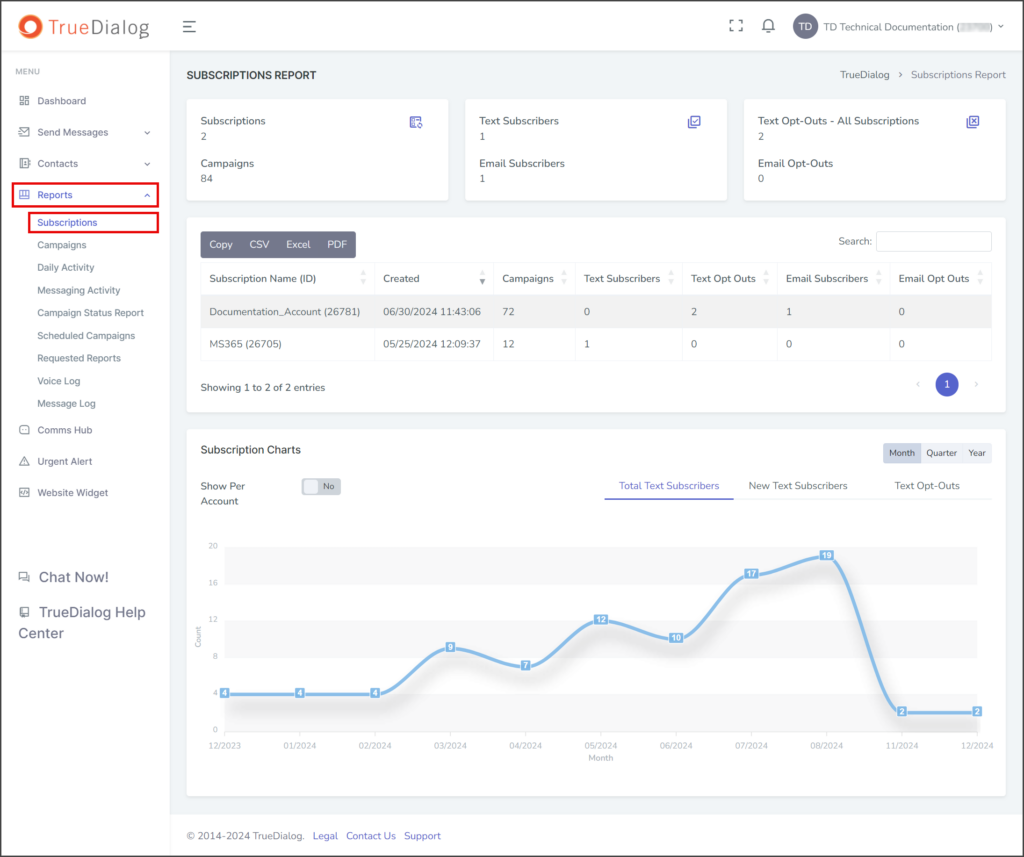
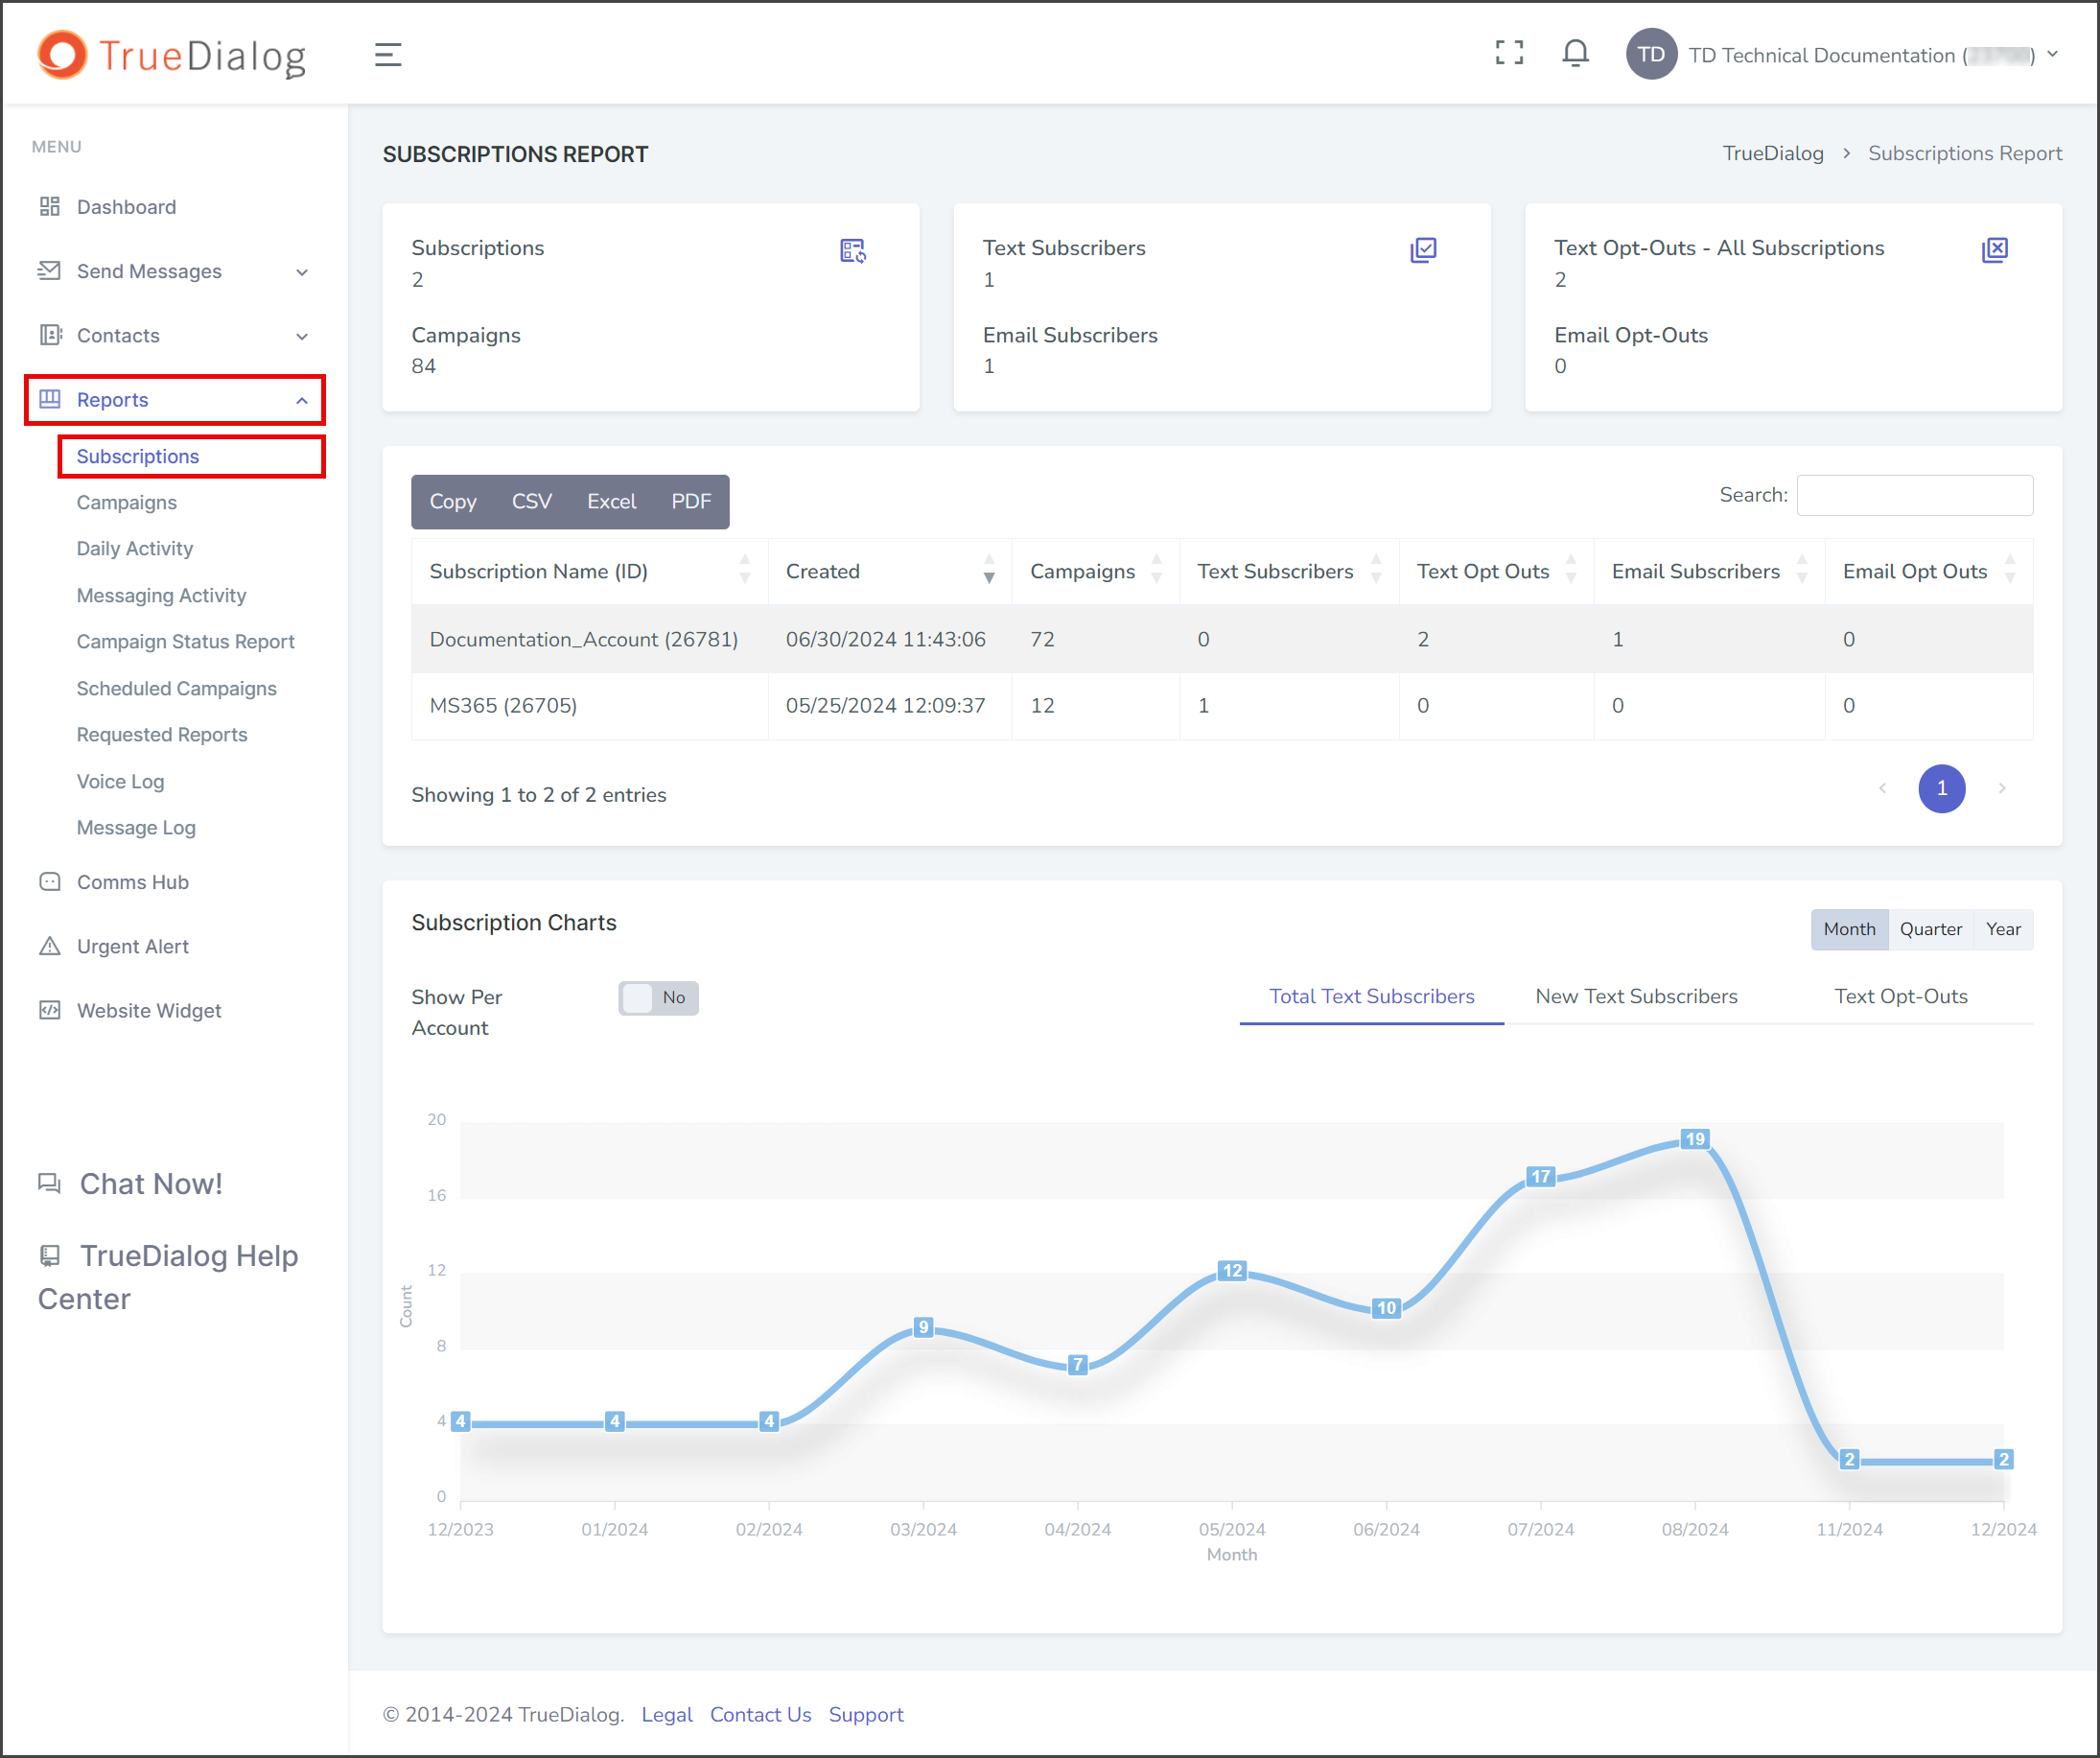
This article will show you the information provided on the Subscriptions Report page. This page provides details about your subscriptions and is divided into three sections:
- An overview of subscription activity
- A table of all subscriptions
- A chart of your subscribers over time
- Expand Reports in the left sidebar and select Subscriptions.
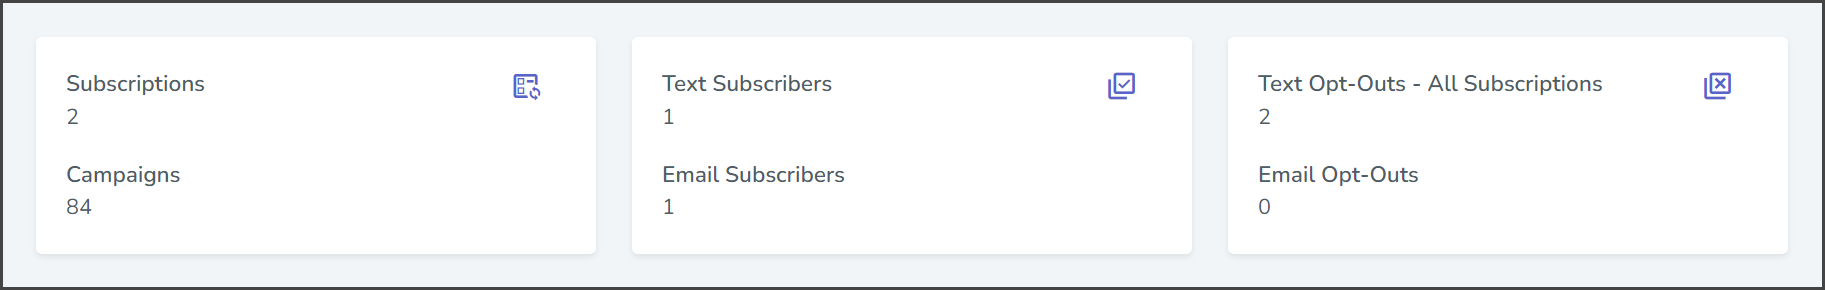
Subscription Activity
The Subscription Activity section gives you a quick overview of your subscriptions, the number of subscribers, and the number of subscribers that have opted out. The values are
Subscription Table
The Subscription Table section gives you a list of all the subscriptions for your account, along with details and statistics for each subscription. The table is searchable and sortable.
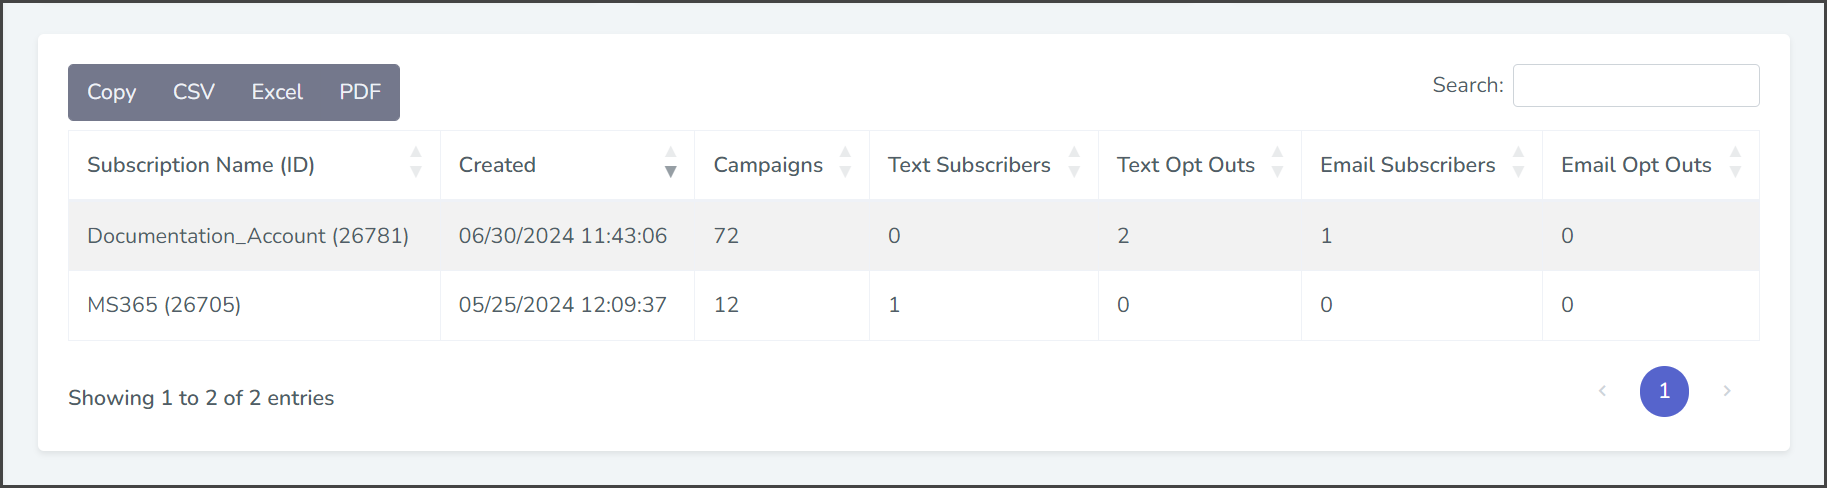
- Start typing your search into the Search box. The search will match your search string to any of the columns and display live results. The search will accept any character as part of the search string.
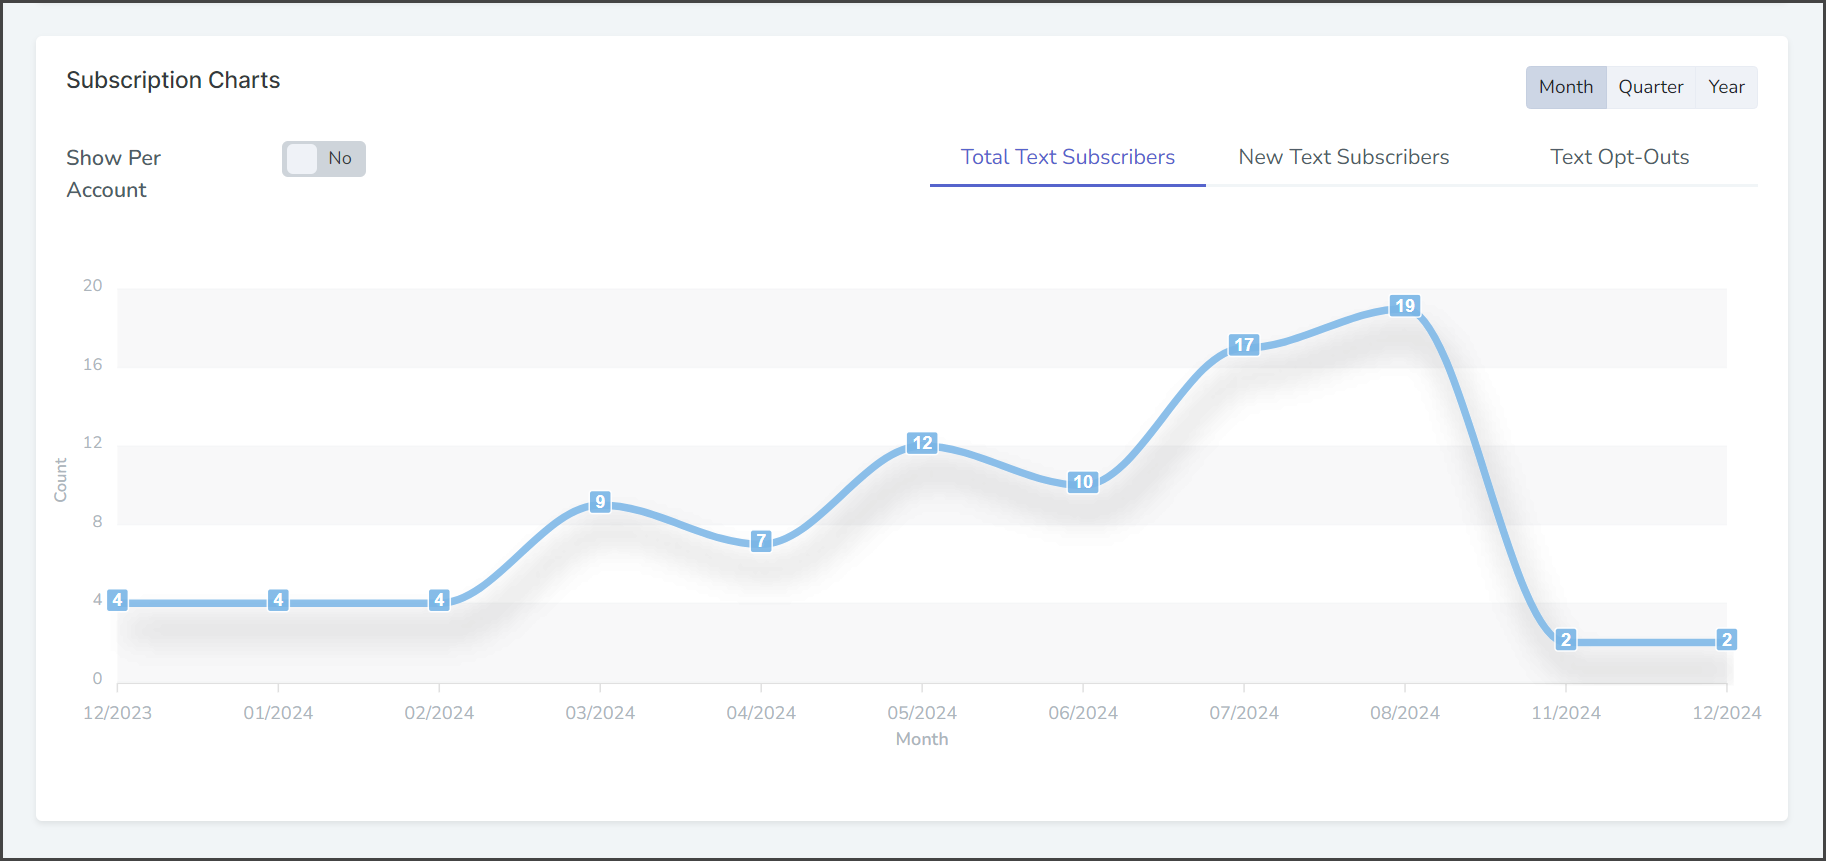
Subscription Charts
The Subscription Charts display your account’s text message subscriber data over time.
- The time interval for the chart can be switched between Month, Quarter, and Year.
- The Show Per Account toggle:
- Yes – The root account and each subaccount are charted as a different color-coded line.
- No (Default) – The totals from all accounts are charted as one line.
- When the mouse cursor hovers over the chart, a window displays the chart data for that specific time. If Show Per Account is enabled, each account’s color, name, and total are shown in the window.
| Chart Type | Description |
|---|---|
| Total Text Subscribers | The number of text message subscribers for all subscriptions at the charted point in time. |
| New Text Subscribers | The number of new text message subscribers for any subscription during the time interval. |
| Text Opt-Outs | The number of text message subscribers who opted out of any subscription during the time interval. |