TrueDialog Portal
Reports > Campaign Report
This guide explains what information is provided for a Survey Campaign. The Campaign Report page gives detailed information about messages sent by the selected campaign.
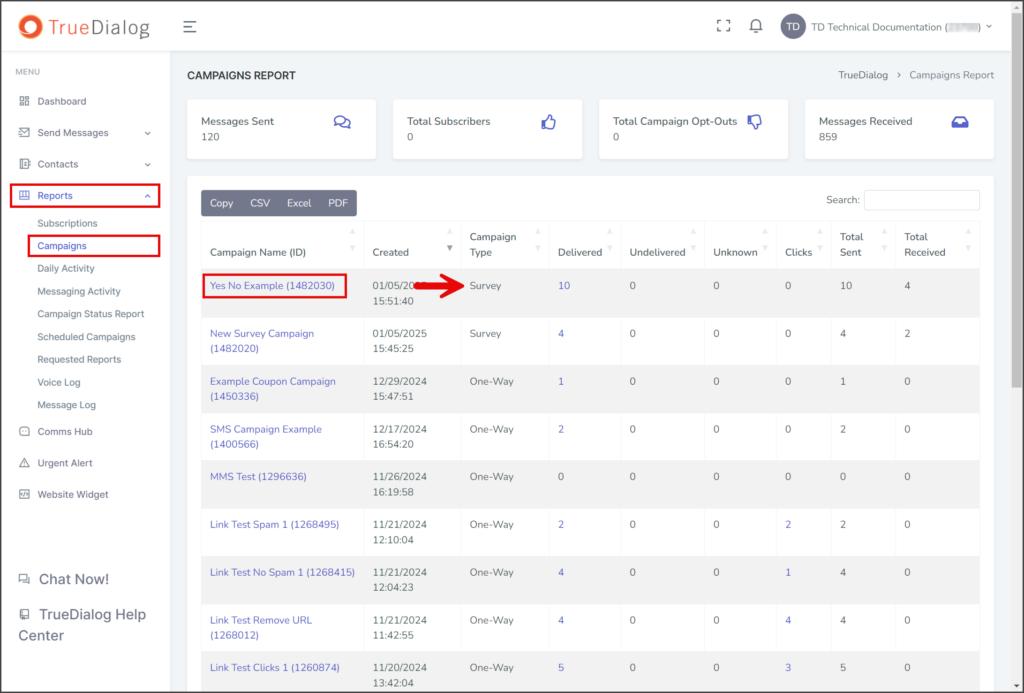
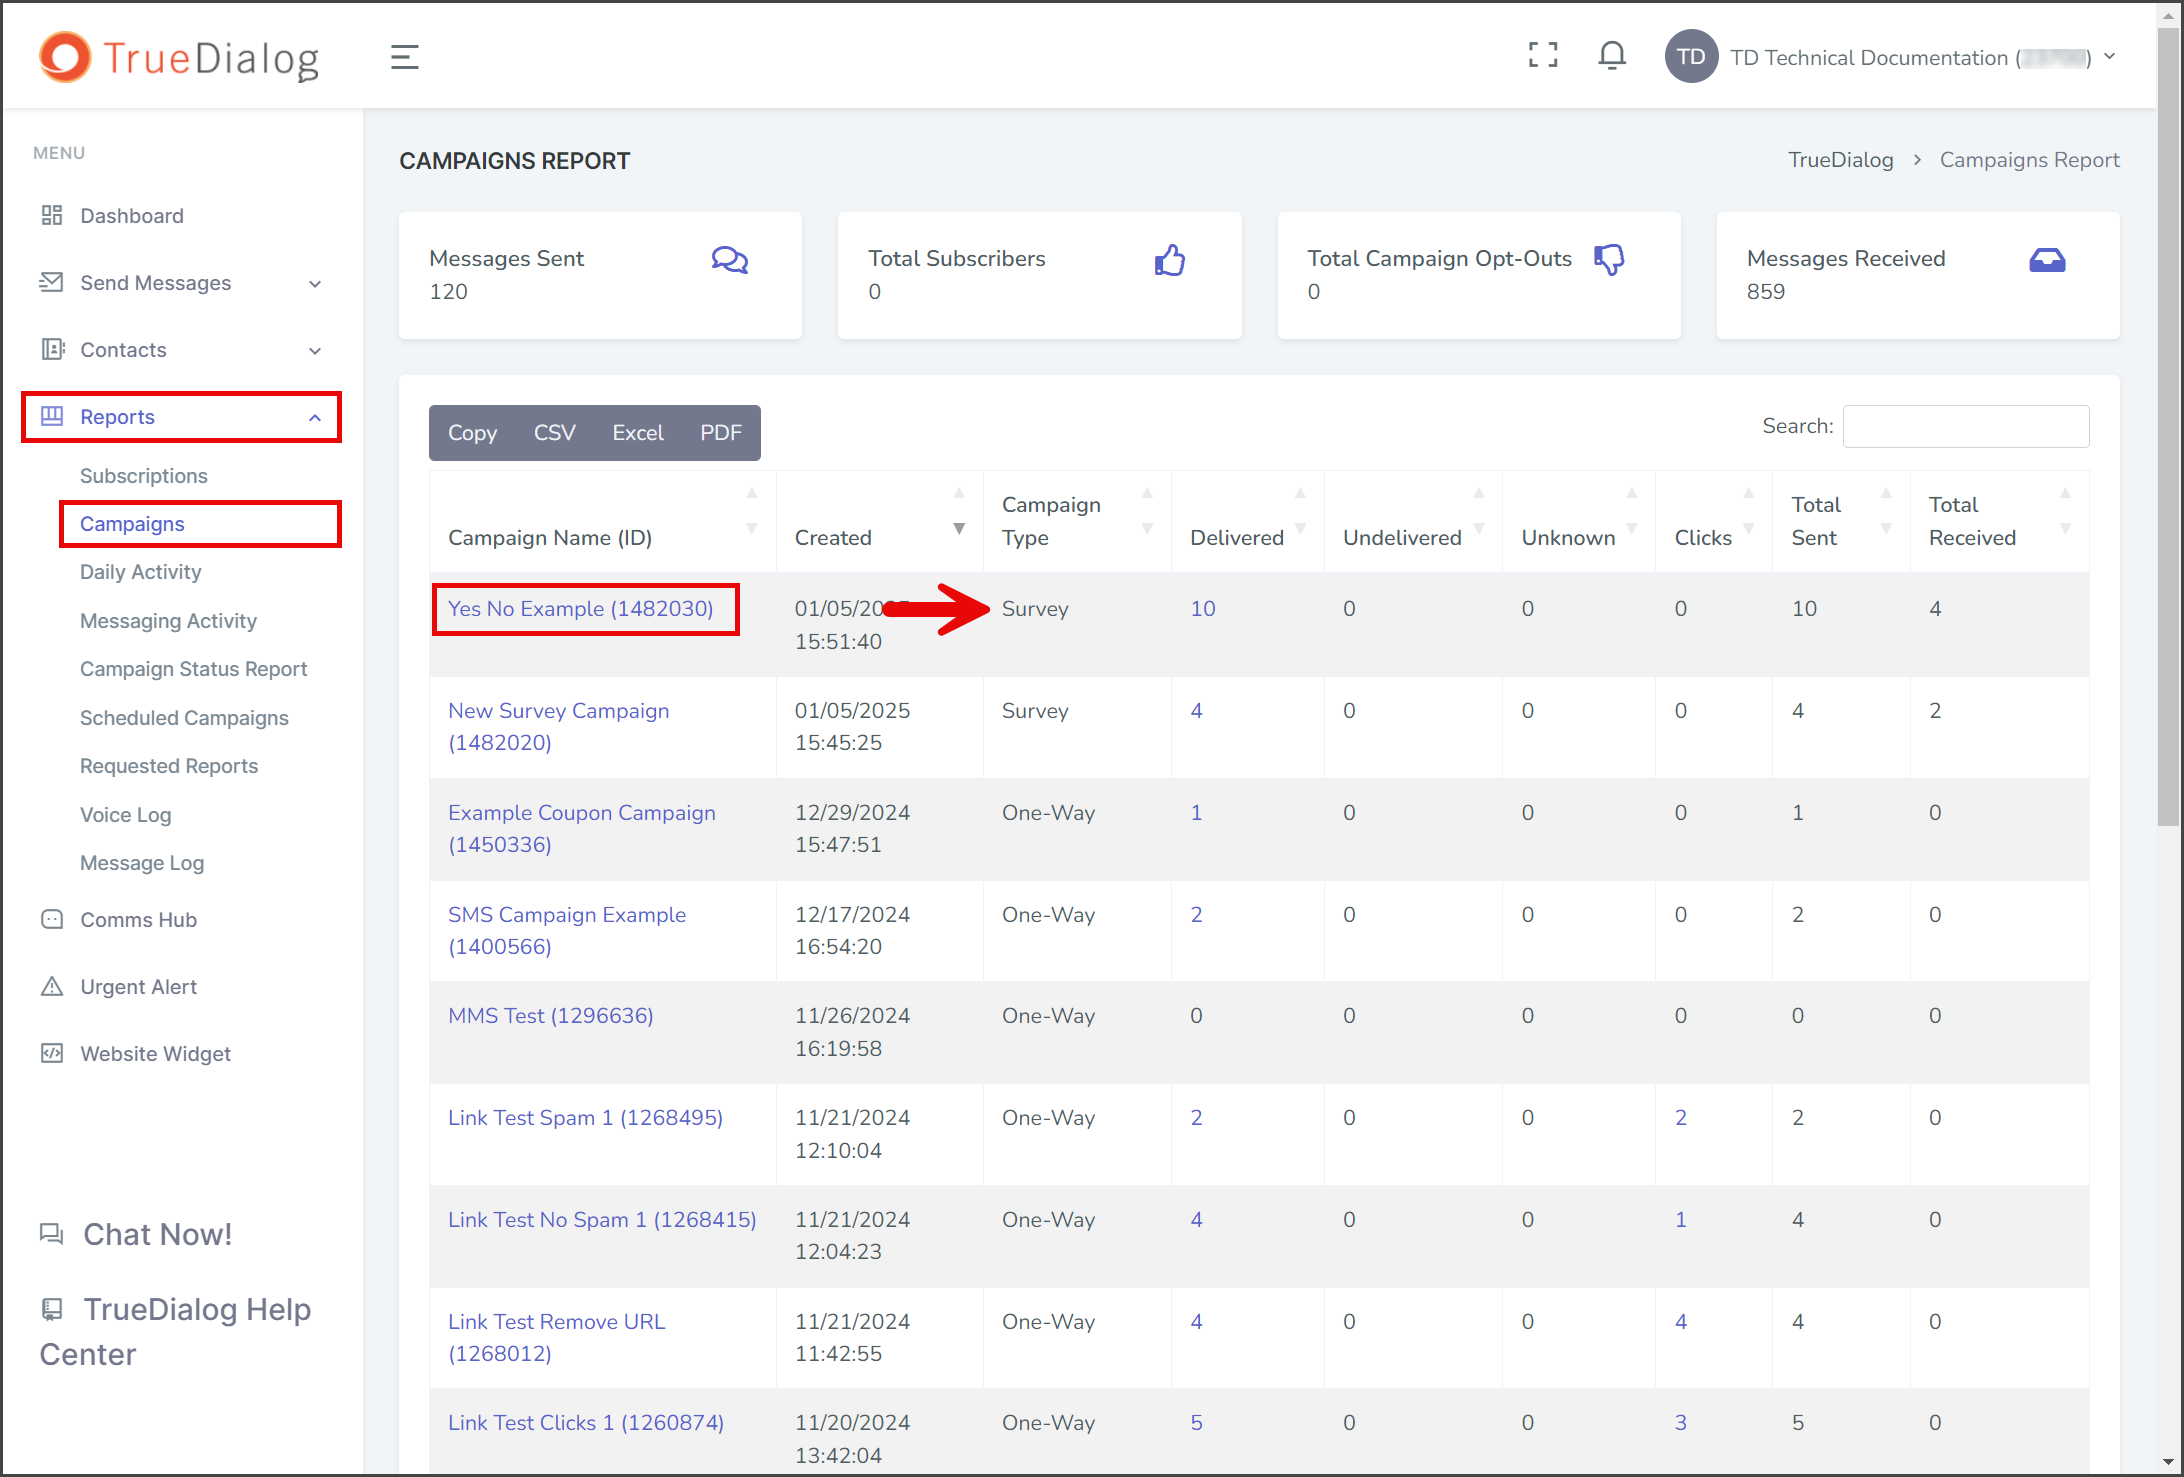
- Expand Reports in the left sidebar and select Campaigns.
- In the table of campaigns, click the Campaign Name for which you wish to see a detailed report. Make sure the Campaign Type for your selected campaign is Survey. For other campaign types, please look at the corresponding guide.
- On the CAMPAIGN REPORT page, there are the following sections:

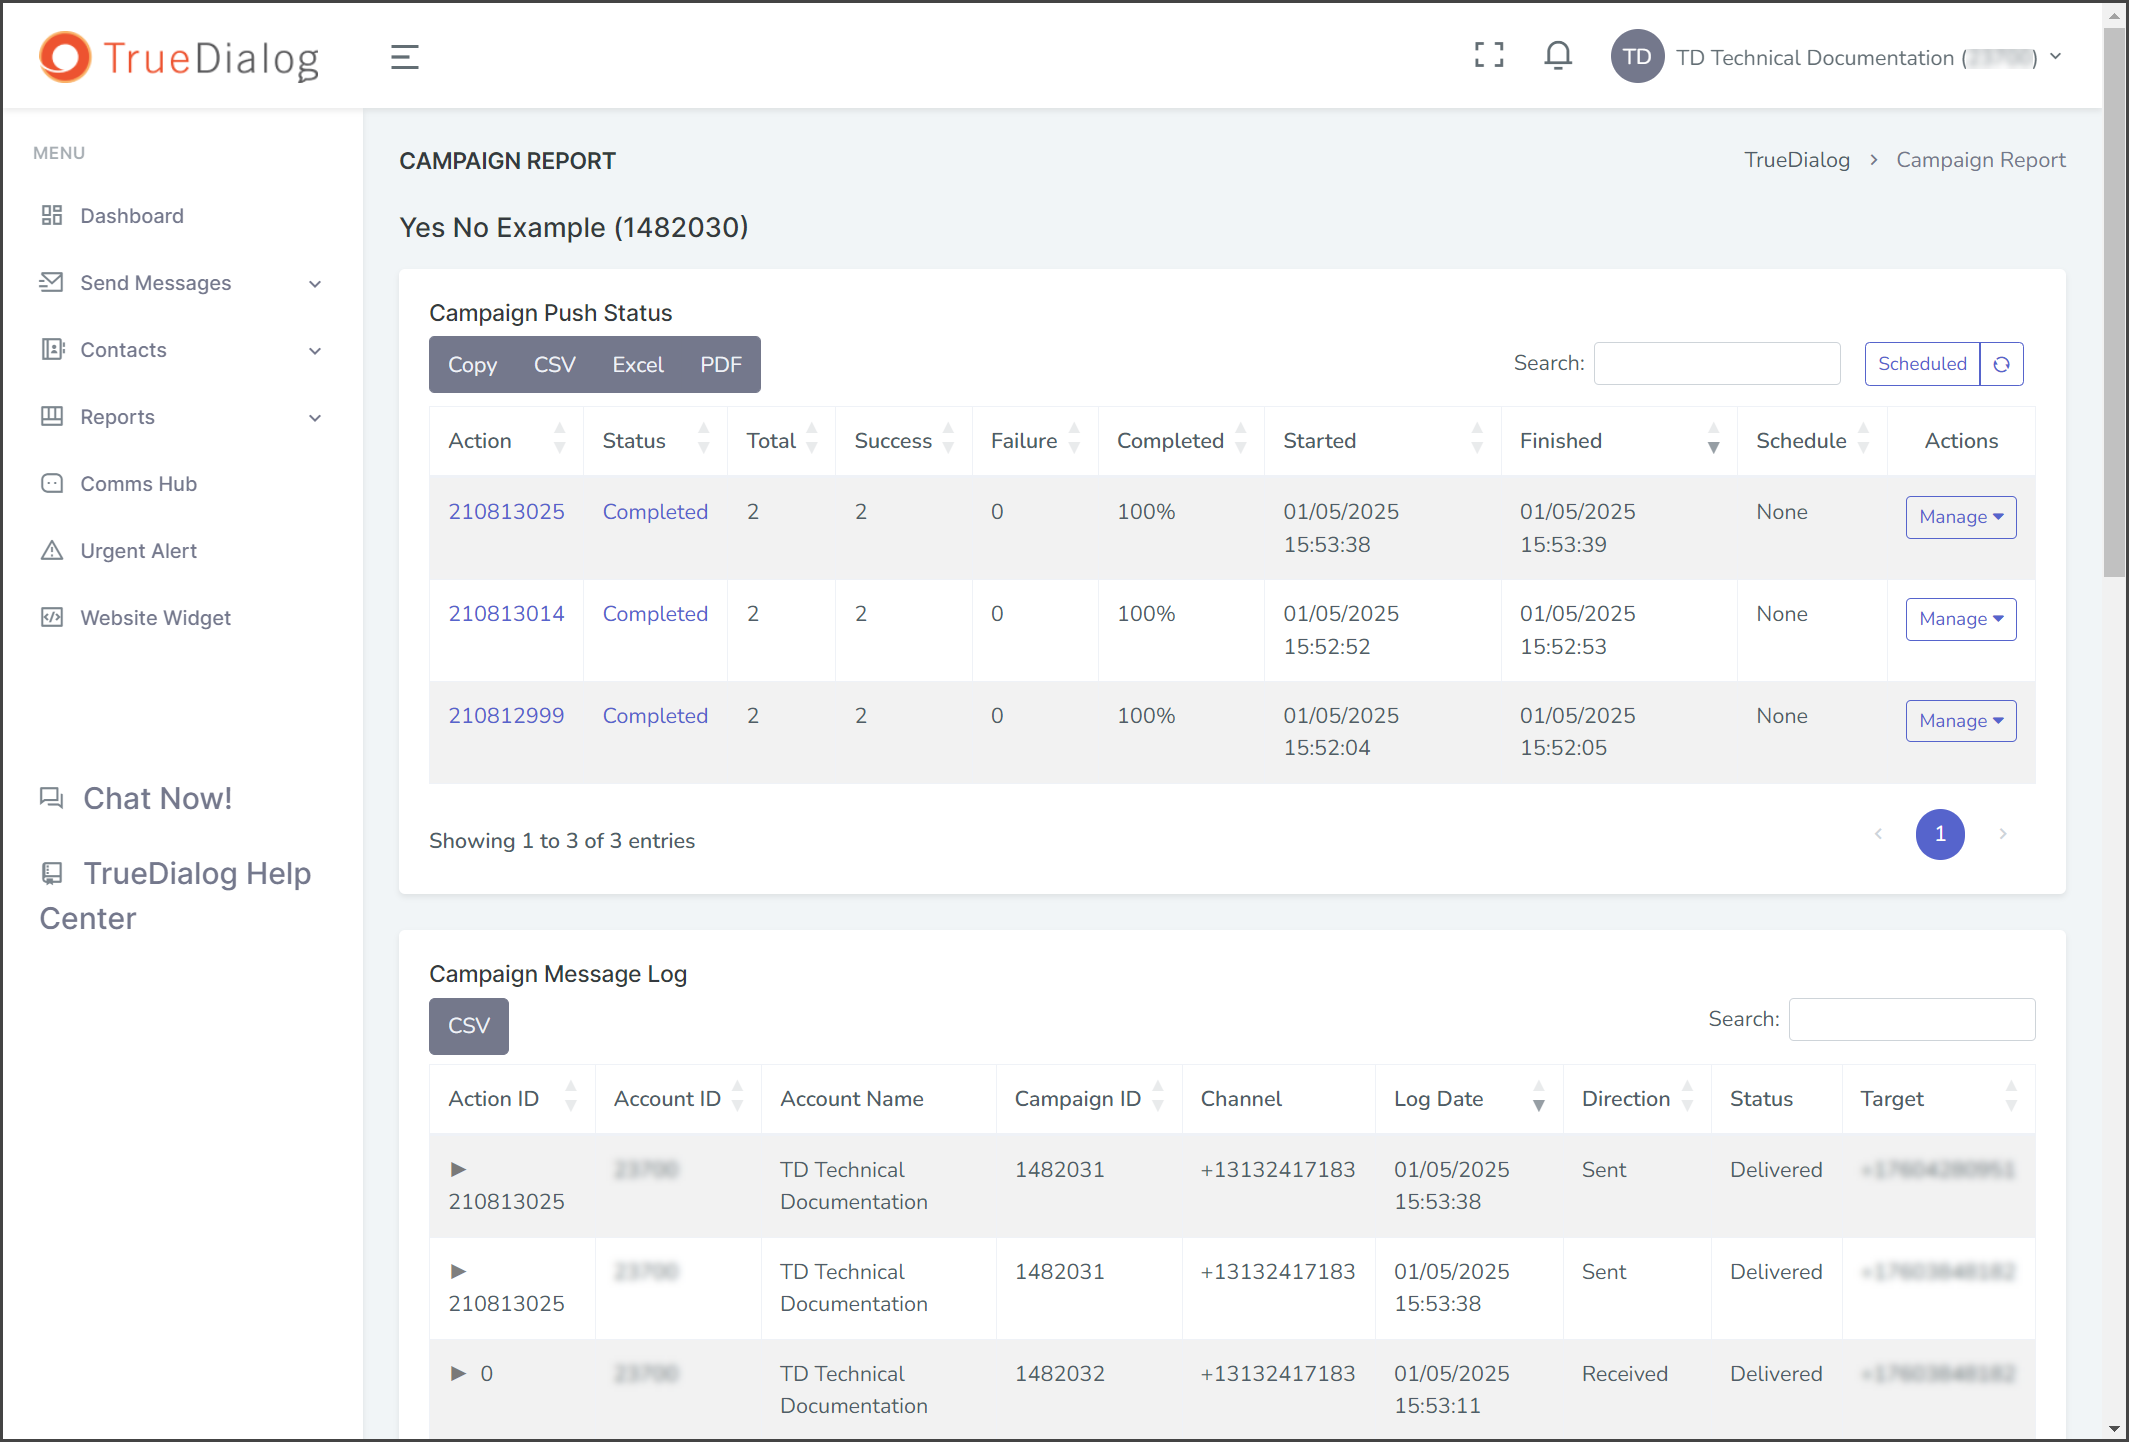
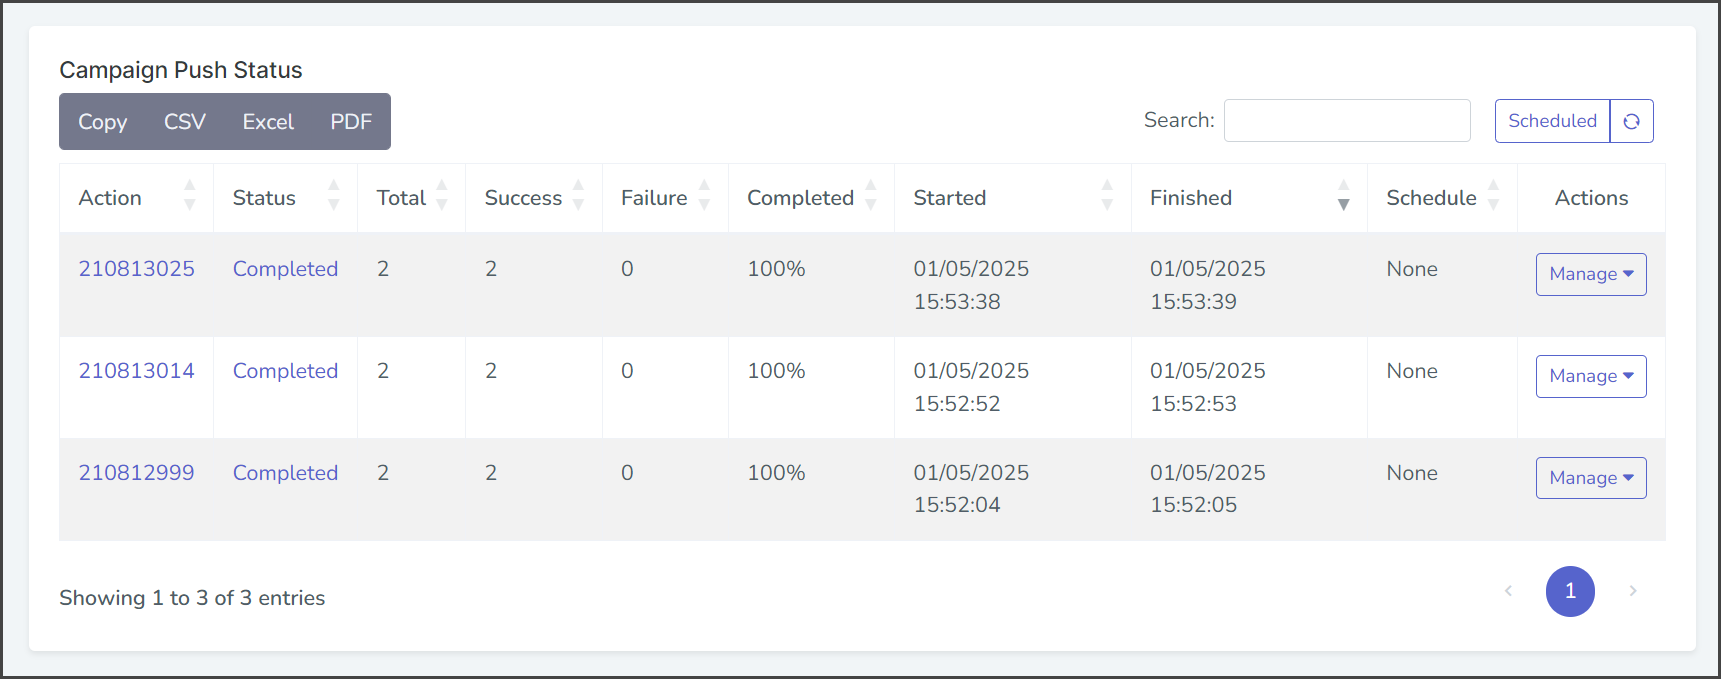
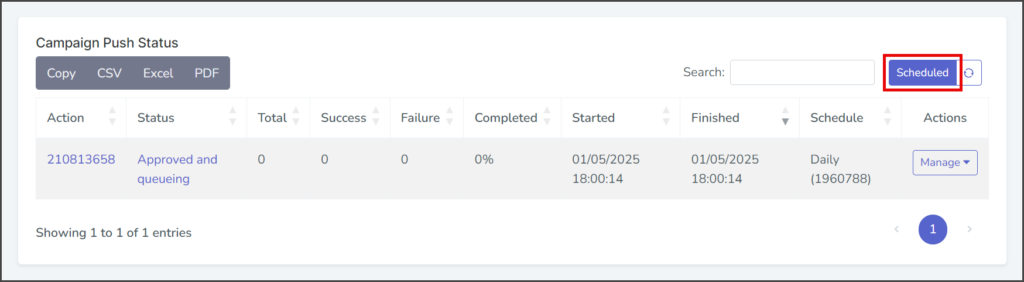
Campaign Push Status
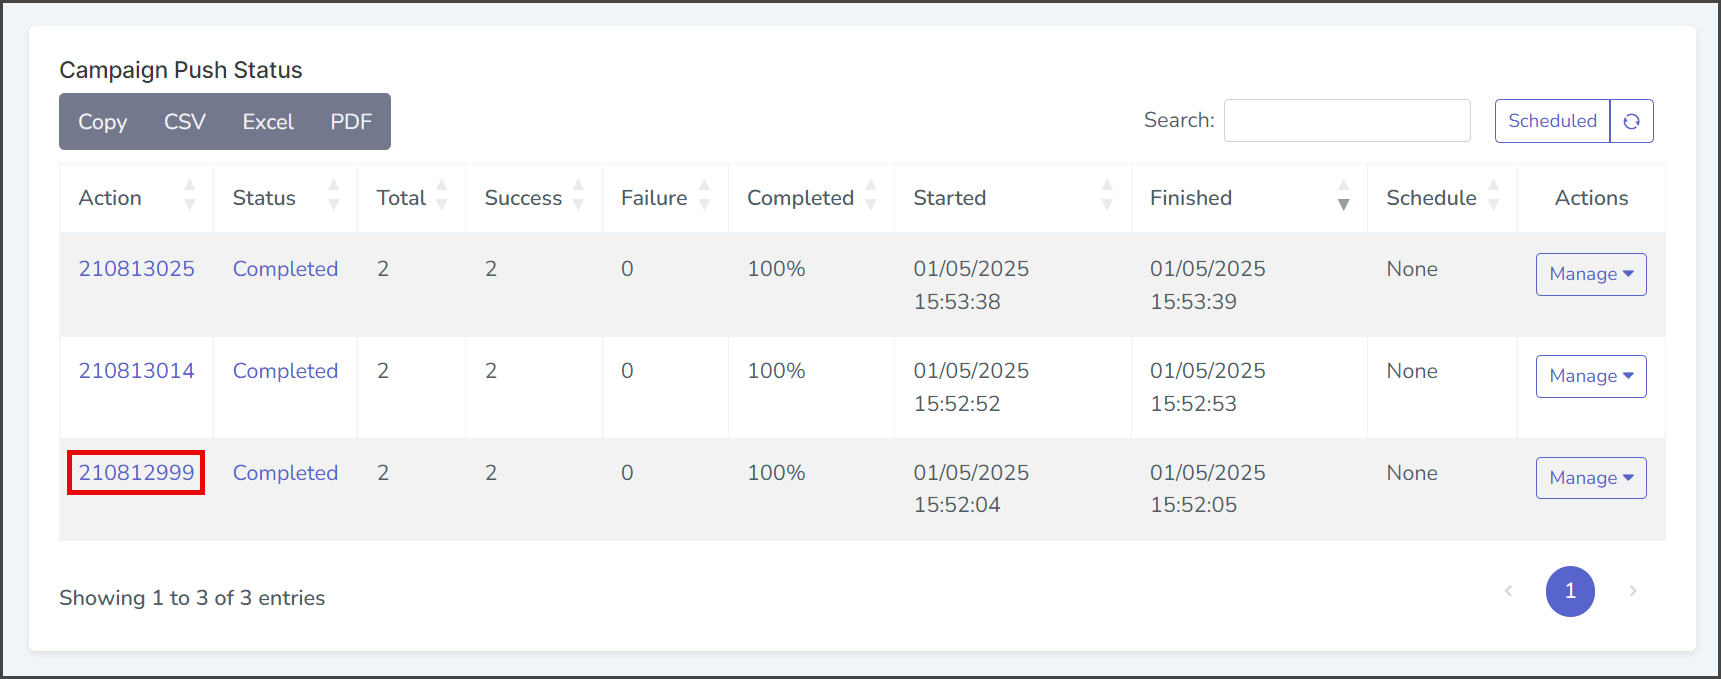
This section displays a log of all push requests the campaign has received. You can view more details, search for, and manage individual push requests. The features of the Campaign Push Status are explained below.
Action Details
To access the Action Details window:
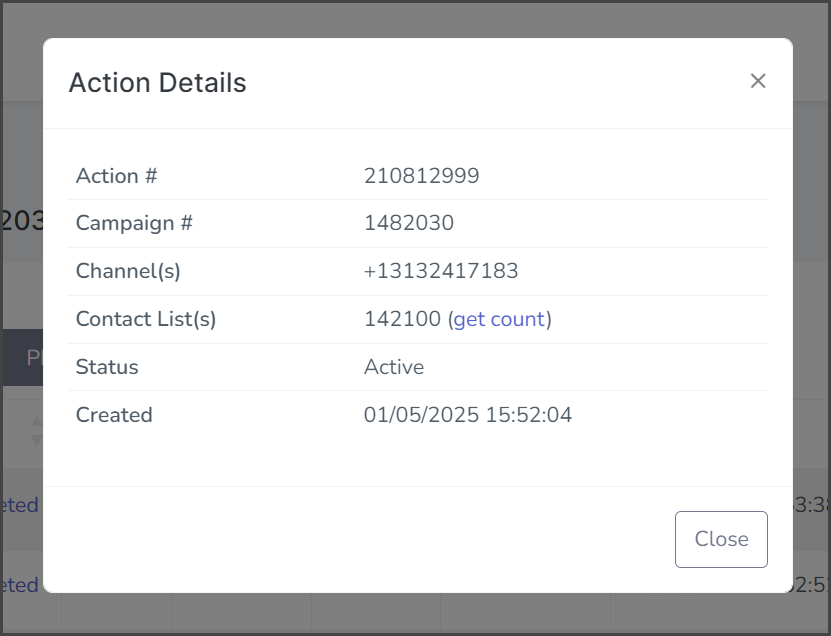
- Find the row with the push request for which you want details.
- Click the action id under the Action column to display the Action Details window.

Action Status Report
To access the Action Status Report window:
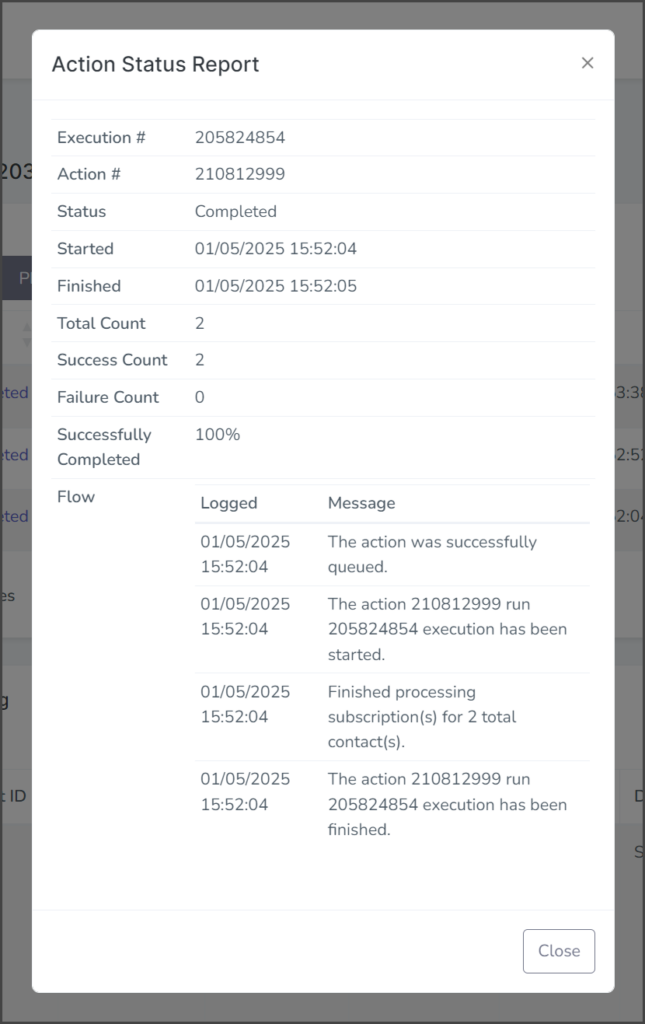
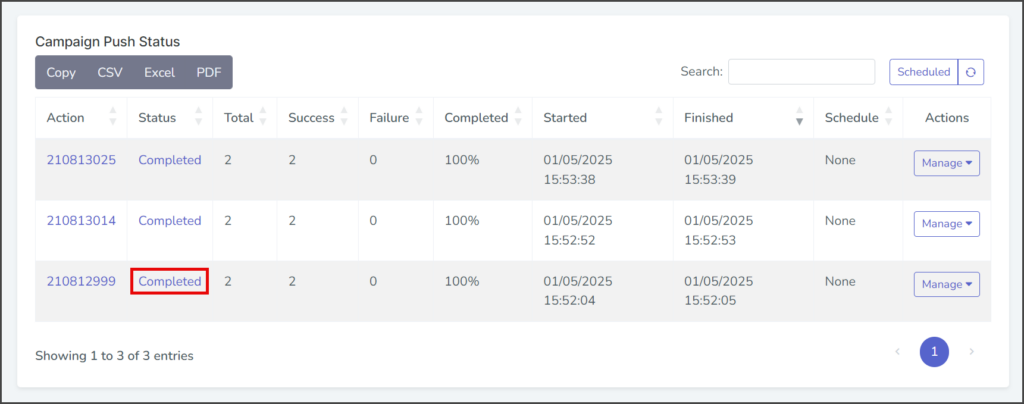
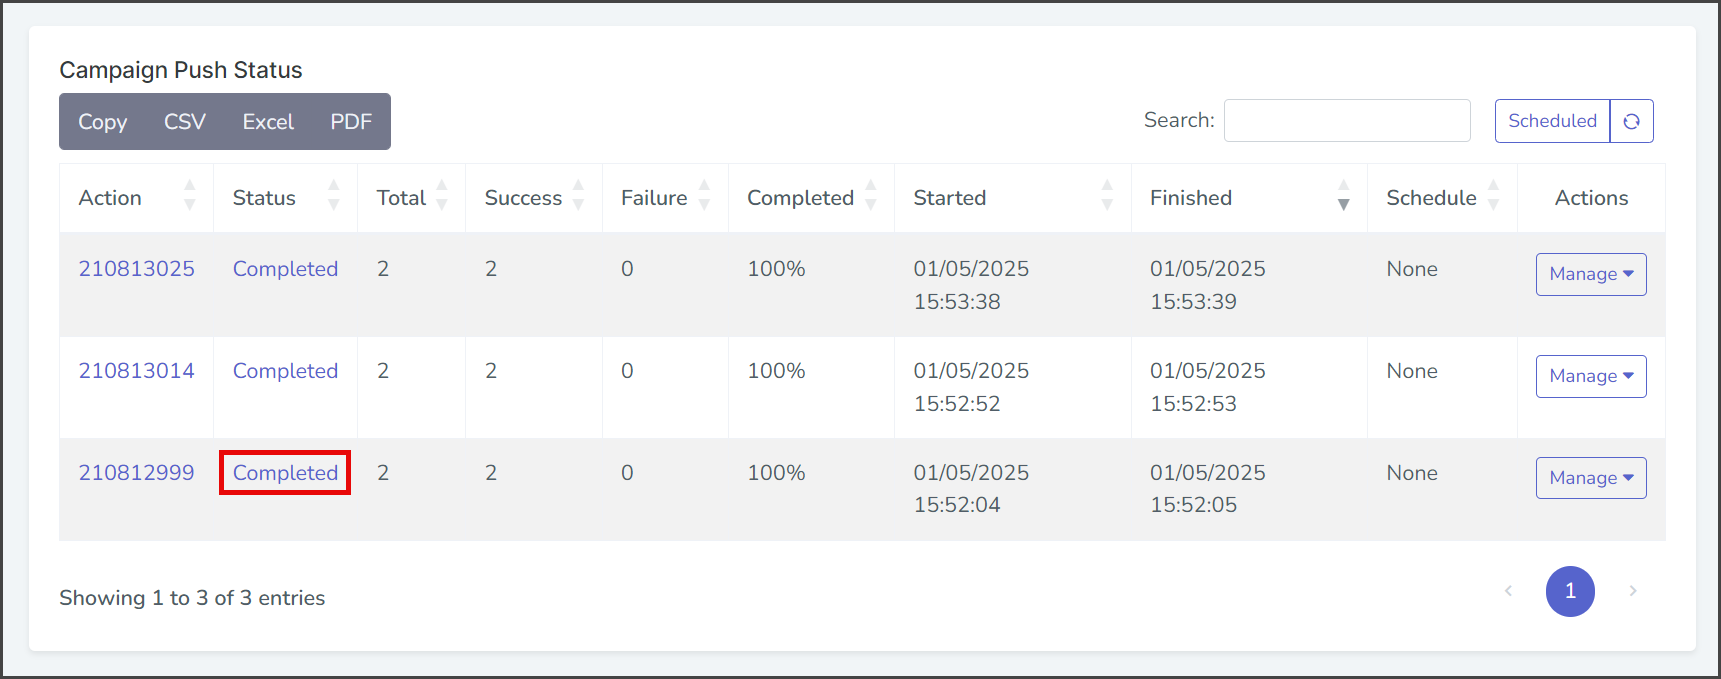
- Find the row with the push request for which you want details.
- Click the status under the Status column to display the Action Status Report window.
Scheduled Log
- Click the Scheduled button to switch to the log with only scheduled push requests. The default log includes both scheduled and immediately executed pushes. Both logs only include scheduled push requests that have been performed. To view push requests scheduled but not executed yet, go to Reports → Scheduled Campaigns.

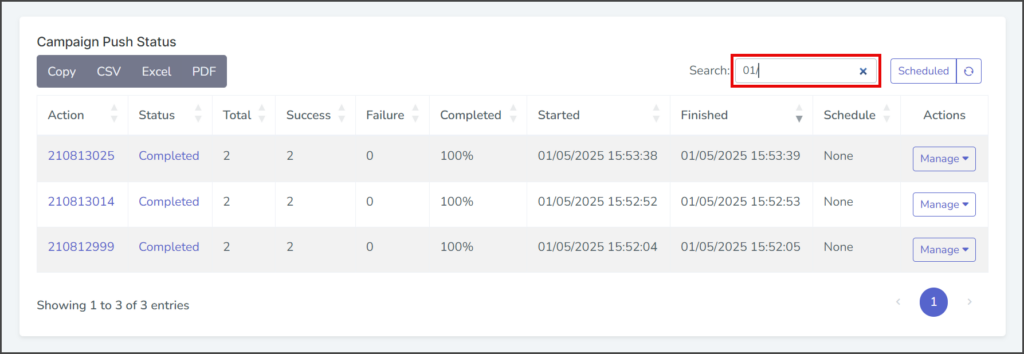
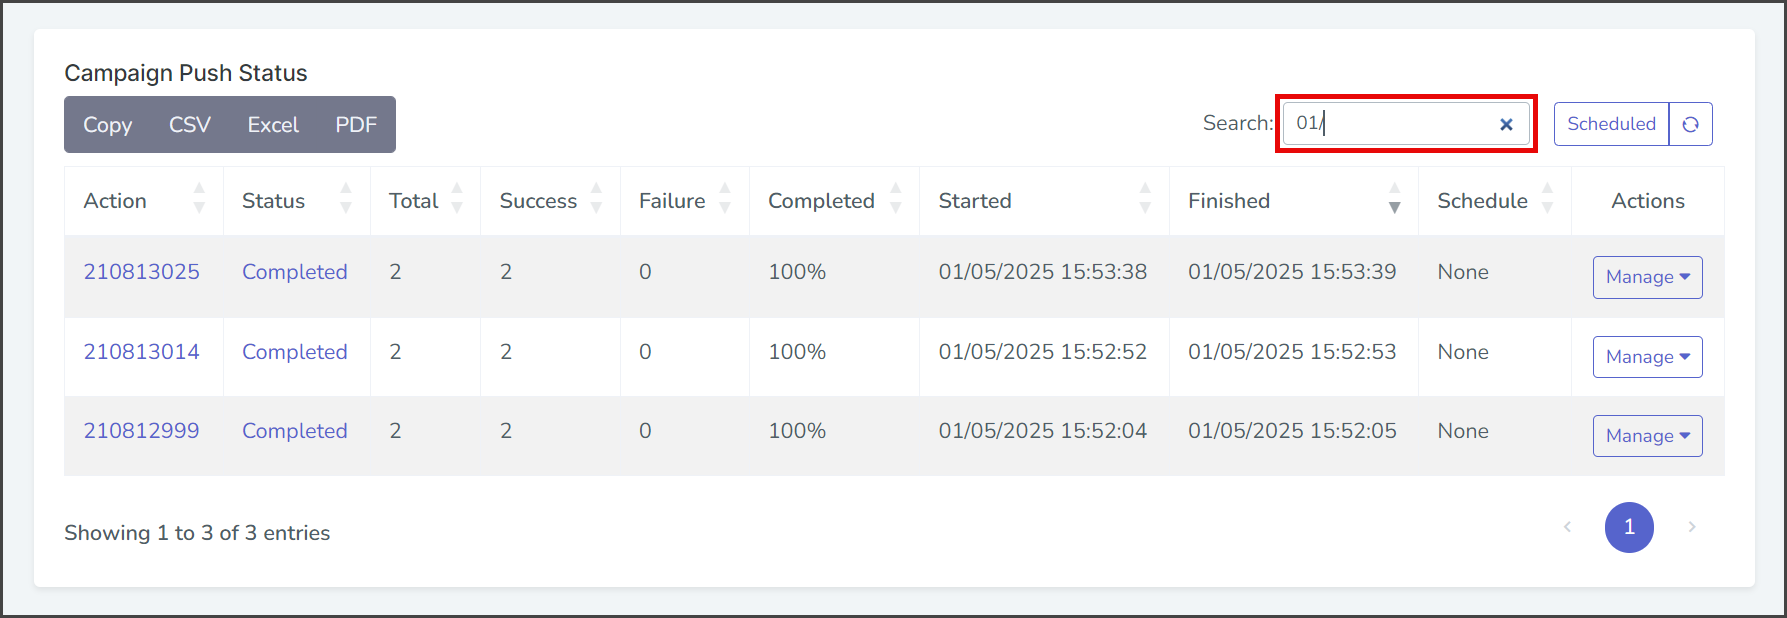
Search Log
- Start typing your search into the Search box. The search will match your search string to any part of the push status information and display live results. For example, to get a list of pushes completed in January, start typing 01/.
Manage Push
- Click the Manage dropdown in the Actions column for the push request you want to manage.
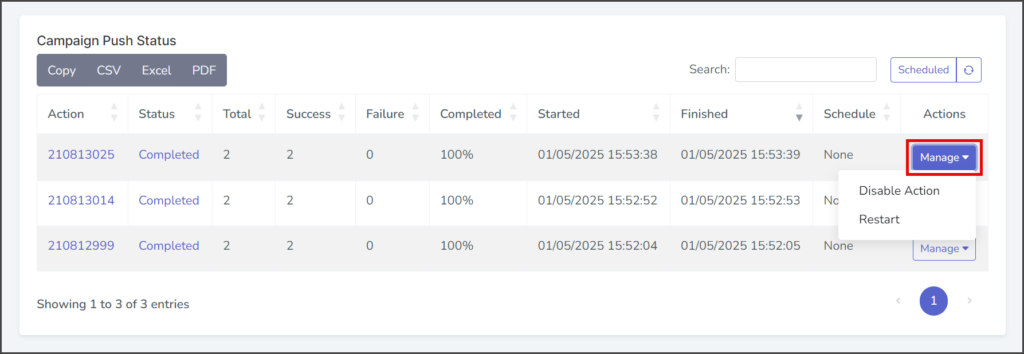
- Disable Action: Select this to stop the campaign from pushing the selected action. This will prevent any scheduled or queued messages related to that action from being sent. If the action is already scheduled, it will be canceled, and no further messages will be sent. If the action is queued, it will be terminated, and no additional messages will be sent.
- Restart: Select this to re-launch a campaign. If this campaign action was previously scheduled, it will be executed immediately and at the scheduled time.
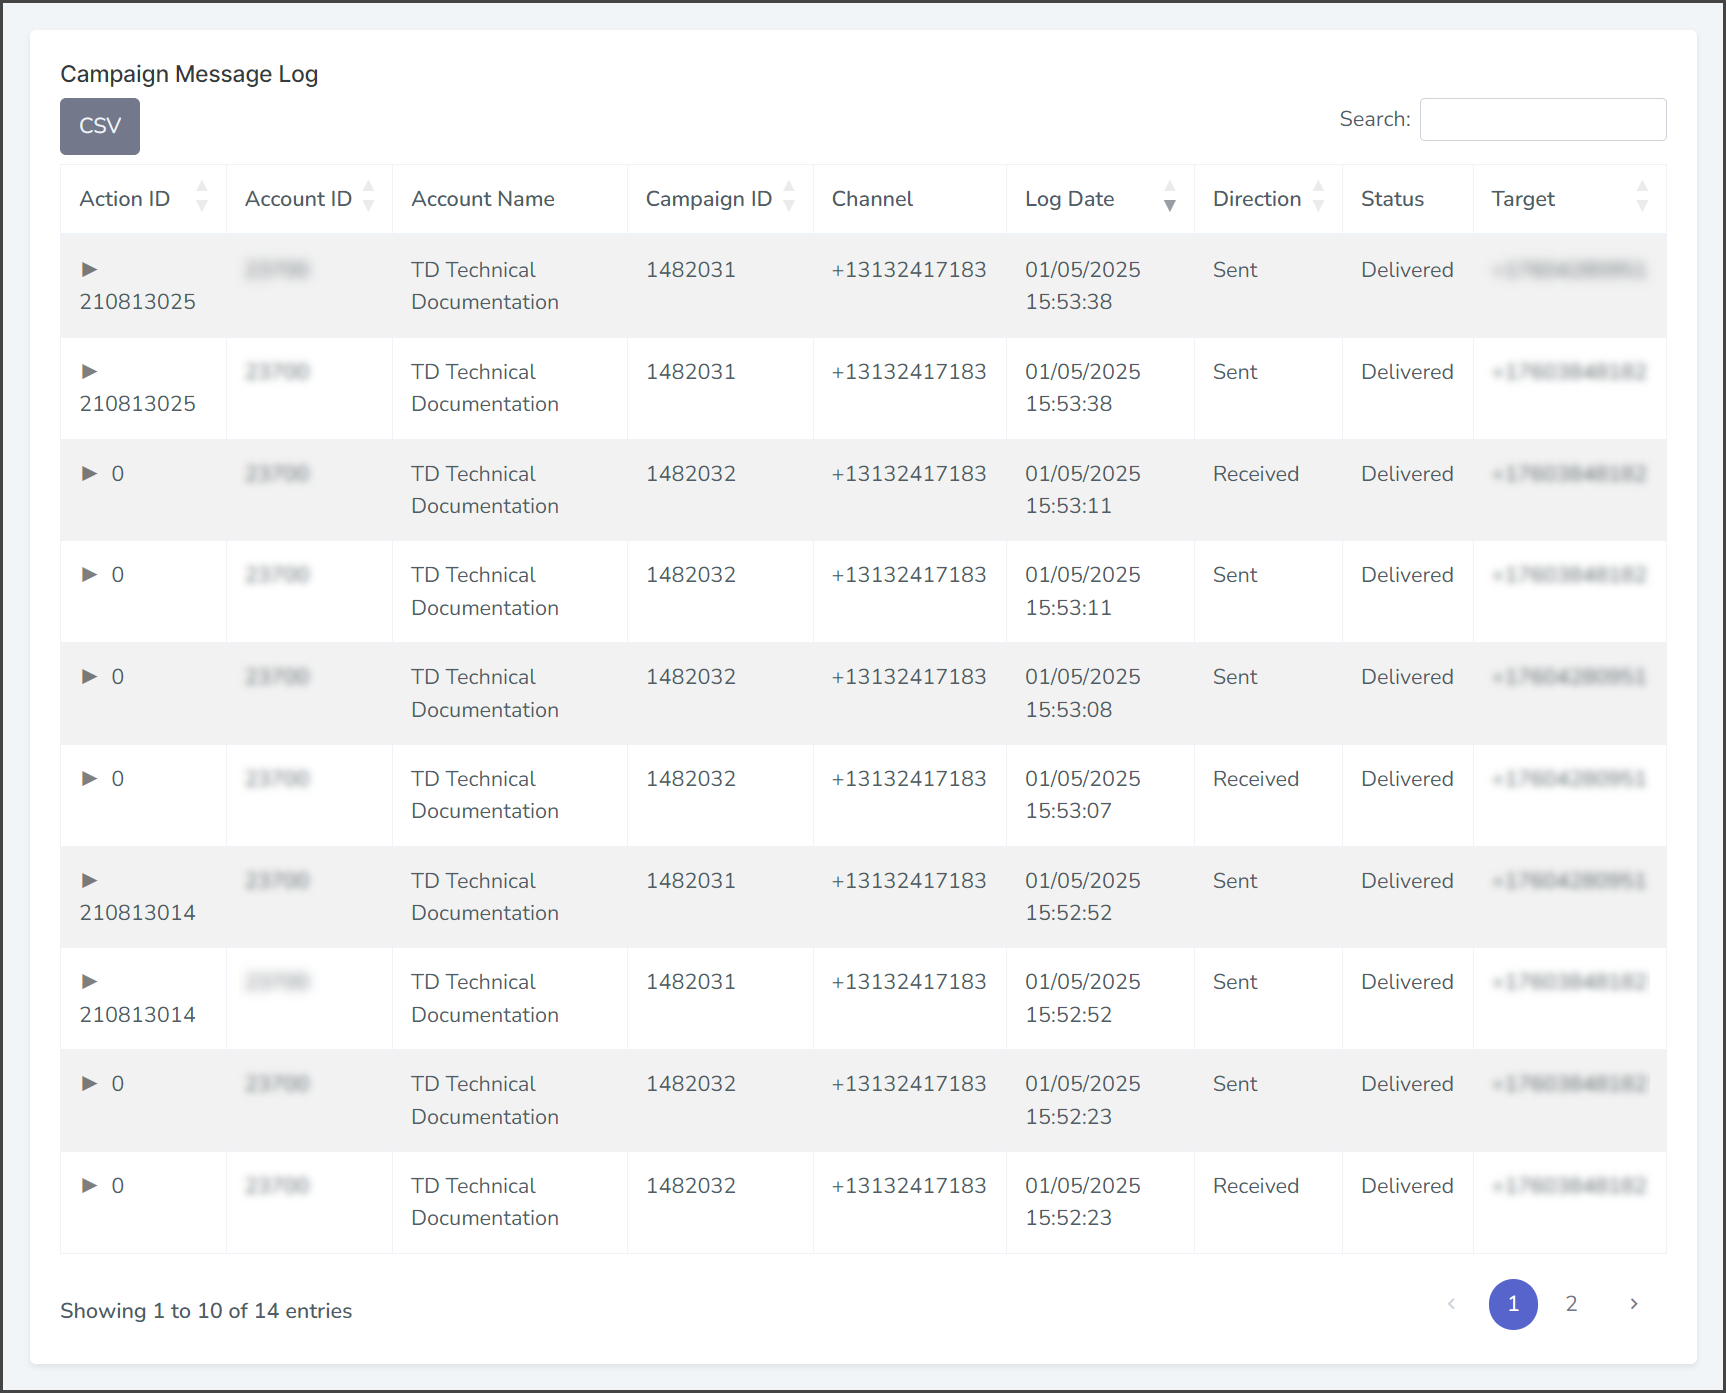
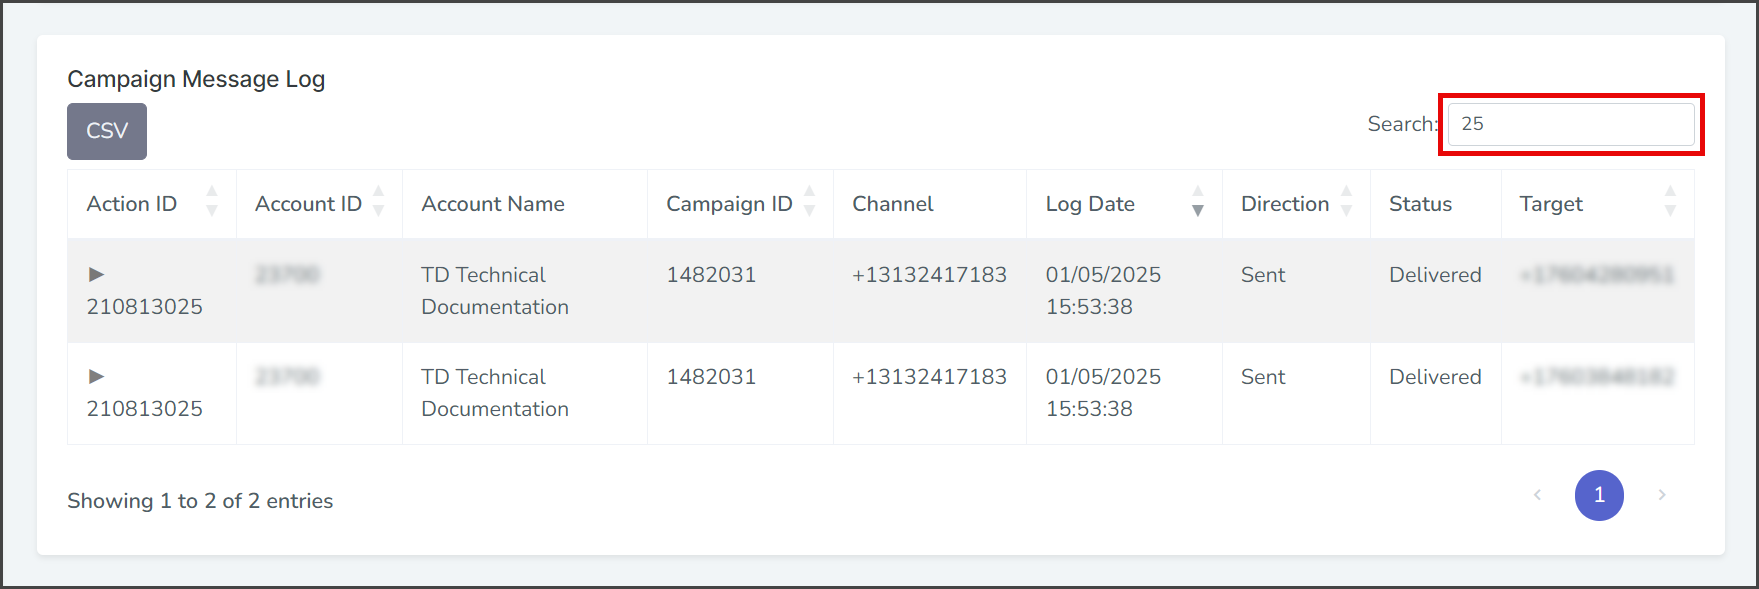
Campaign Message Log
This section displays a log of the campaign messages every time the campaign pushes a message to end users. The log can be searched to find a specific push.
Search Log
- Start typing your search into the Search box. The search will match your search string to any part of the Action ID, Account ID, or Campaign ID and display the results live. Note: Entering non-numeric characters in the search box cancels the search.

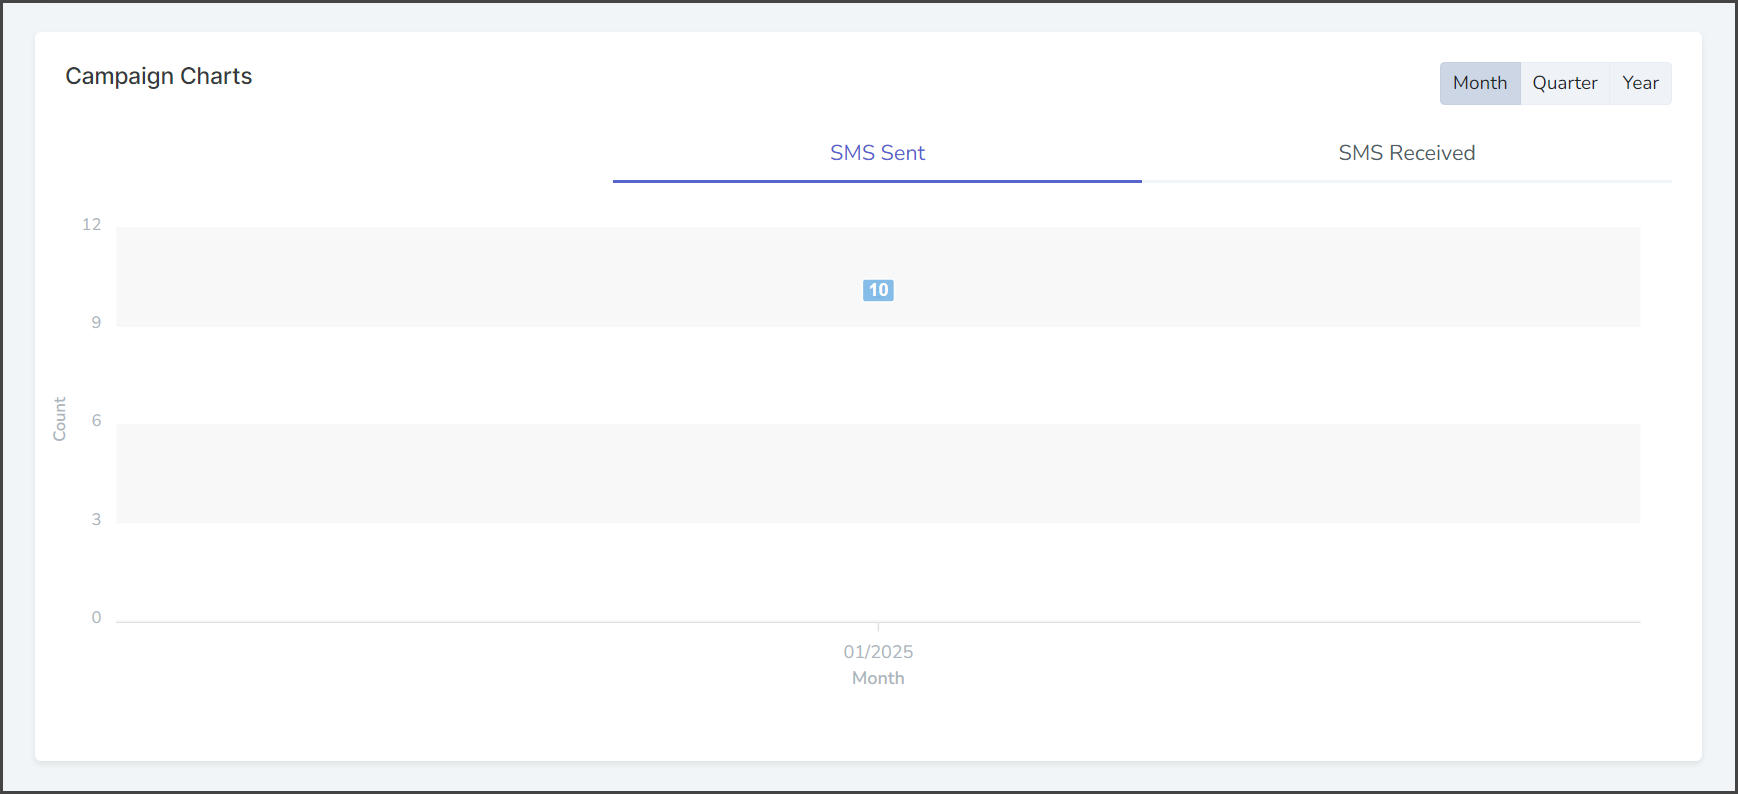
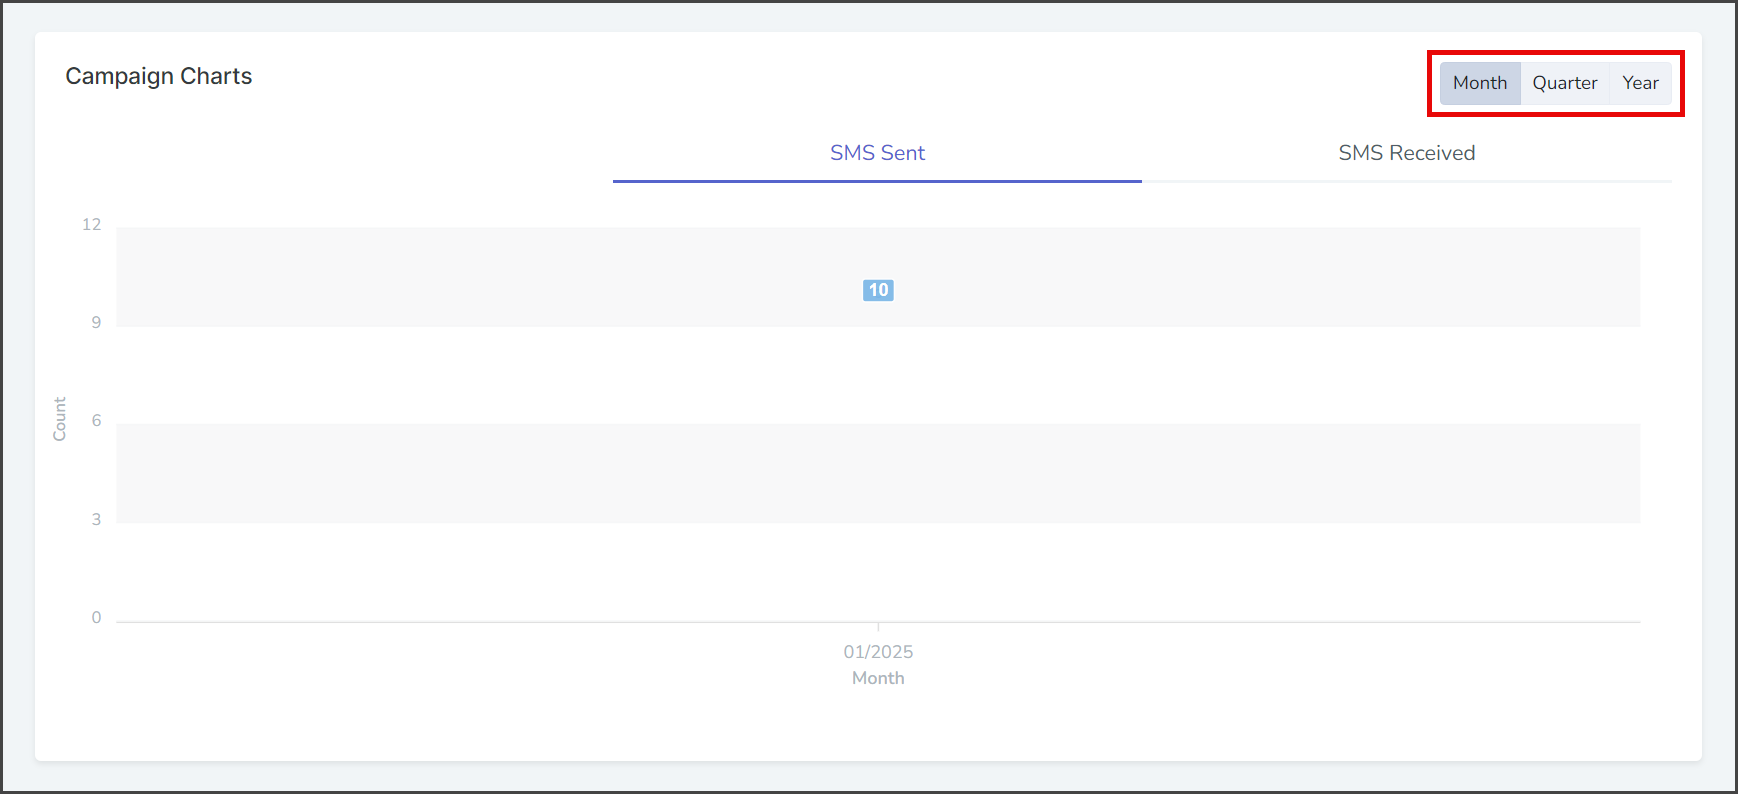
Campaign Charts
The Campaign Charts display a smooth line chart of the number of messages sent or received for the date range.
Set Chart Range
You can set the chart to display data over different intervals of time.
- Click Month to display data for the last 30 days.
- Click Quarter to display data for the current quarter.
- Click Year to display data for the current year.
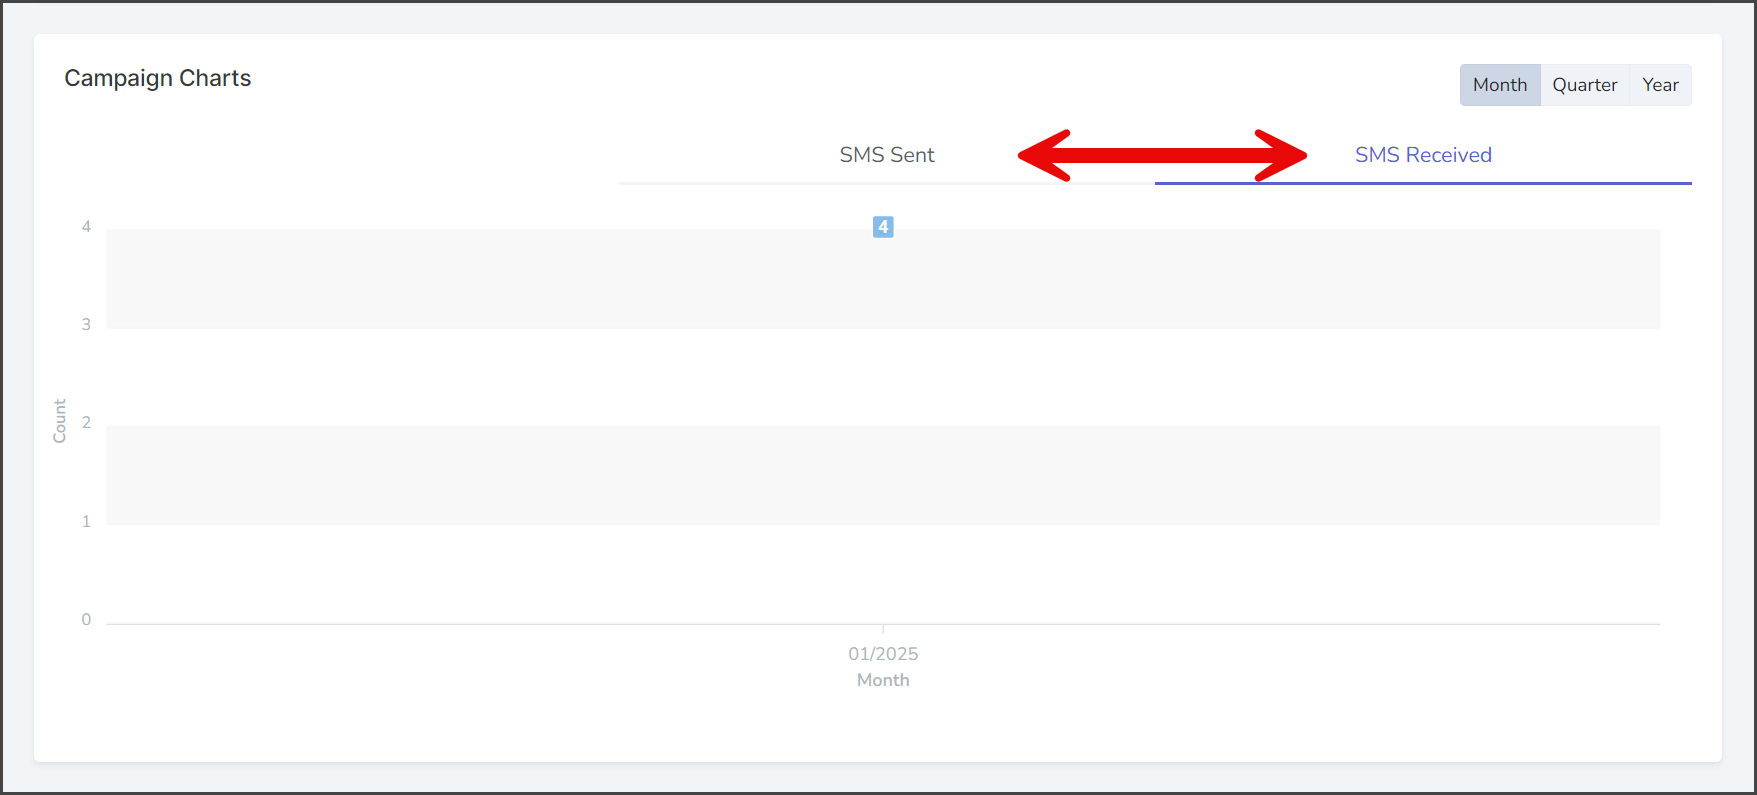
Set Chart Data
You can set the chart to display different sets of data. This campaign allows you to switch between SMS Sent and SMS Received.
- Click SMS Sent to display the number of SMS messages the campaign sent during the time interval.
- Click SMS Received to display the number of SMS messages the campaign received during the time interval.
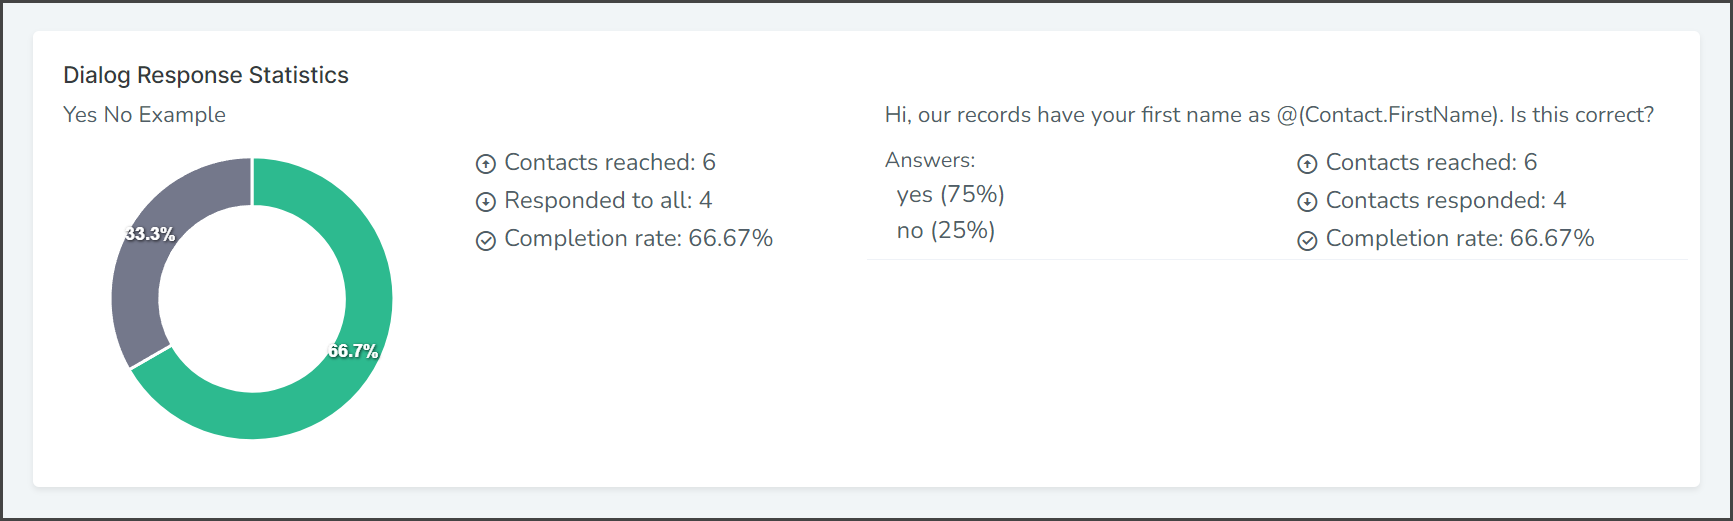
Dialog Response Statistics
In the Dialog Response Statistics section, you can view helpful statistics related to the success rate of your campaign. The pie chart displays the overall completion percentage for the entire campaign, while the right-hand side of the page shows the individual statistics for each question. This information lets you identify which questions your end users struggle with and the most commonly provided answers.